
User's Manual

108 Chapter 3 Configuring and graphing ports
209322-B
Bridge tab for graphing ports
The Bridge tab displays port frame statistics.
To open the Bridge tab for graphing:
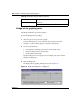
1 Select the port or ports you want to graph.
To select multiple ports, [Ctrl] + left-click the ports that you want to
configure. A yellow outline appears around the selected ports.
2 Do one of the following:
• From the Device Manager main menu, choose Graph > Port.
• From the shortcut menu, choose Graph.
• On the toolbar, click Graph.
The Port dialog box for a single port or for multiple ports opens with the
Interface tab displayed.
3 Click the Bridge
tab.
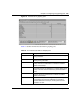
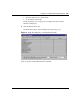
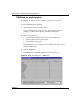
The Bridge tab for graphing multiple ports opens (Figure 45).
Figure 45 Graph Port dialog box — Bridge tab
Default: 10s
Range: None, 2s, 5s, 10s, 30s, 1m, 5m, 30m 1h
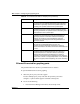
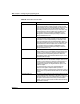
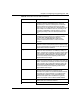
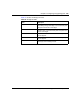
Table 38 Ethernet Errors tab fields (continued)
Field Description