
User's Manual


112 Chapter 3 Configuring and graphing ports
209322-B
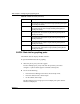
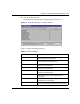
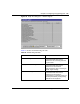
EAPOL Stats tab for graphing ports
The EAPOL Stats tab displays EAPOL statistics.
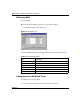
To open the EAPOL Stats tab for graphing:
1 Select the port or ports you want to graph.
To select multiple ports, [Ctrl] + left-click the ports that you want to
configure. A yellow outline appears around the selected ports.
2 Do one of the following:
• From the Device Manager main menu, choose Graph > Port.
• From the shortcut menu, choose Graph.
• On the toolbar, click Graph.
The Port dialog box for a single port or for multiple ports opens with the
Interface tab displayed.
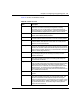
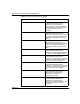
<=64 The total number of packets (including bad packets) received that
were less than or equal to 64 octets in length (excluding framing bits
but including FCS octets).
>64 The total number of packets (including bad packets) received that
were greater than 64 octets in length (excluding framing bits but
including FCS octets).
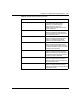
>127 The total number of packets (including bad packets) received that
were greater than 127 octets in length (excluding framing bits but
including FCS octets).
>255 The total number of packets (including bad packets) received that
were greater than 255 octets in length (excluding framing bits but
including FCSoctets).
>511 The total number of packets (including bad packets) received that
were greater than 511 octets in length (excluding framing bits but
including FCS octets).
>1023 The total number of packets (including bad packets) received that
were greater than 1023 octets in length (excluding framing bits but
including FCS octets).
Table 40 RMON tab fields (continued)
Field Description