Chapter 1 Device Manager basics 47
Reference for the Business Policy Switch 2000 Management Software Operations
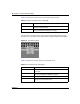
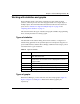
Figure 14 Bar graph
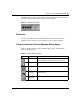
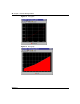
Figure 15 Pie graph
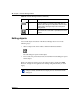
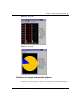
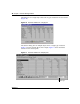
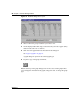
Statistics for single and multiple objects
Statistics for a selected object or objects are displayed in the statistics dialog box.