
User guide

Report Basics
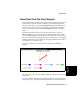
5-6 About Real-Time Graph Reports
Things to Remember About Real-Time Graph
Reports
5
There are several things you need to remember when planning a Real-
Time Graph:
●
Items appear on the graph in the order in which you select them.
●
You cannot select some table items in a Real-Time Graph Report
because:
— They are not measurements (for example, Agent extension in
the Agent Summary table), or
— BCMS Vu automatically includes them on the graph (for
example, the x-axis labels for Agent Summary are Agent
Names).
●
You should consider the probable range of maximum values when
you decide which items of a table to show in a Real-Time Graph. If
you include items that vary significantly in their ranges of values,
items with smaller ranges will appear not to update when they are
displayed. For example, assume you want to monitor a group of
items, one of which has typical values of about 100 and varies
between 50 and 150, and another that has typical values of about
five and varies between two and eight. If both of these items are
displayed on the same Real-Time Graph, the changes in the smaller
item may not be noticeable.
●
Real-Time Graphs update as fast as every ten seconds.
Downloading of historical data takes precedence over the updating
of real-time data. Therefore, real-time reports will update at a
slower rate while historical data are downloading from the
DEFINITY system to the historical database.
●
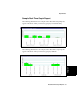
If you display too many items in a graph with vertical bars, their
values will not appear above the bars. If the label containing the
value of the item is wider than the bar, the value is not shown. This
prevents numbers from overlapping numbers above adjacent bars.
●
If there is no data available from the DEFINITY system, zeros
appear above the names of the items.
●
You cannot print Real-Time Graph Reports.