
User guide

Report Basics
Chapter 5
About Real-Time Pie Chart Reports 5-9
About Real-Time Pie Chart Reports 5
BCMS Vu Real-Time Pie Charts provide periodically updated images of the
current status of the call center. The first time you open a BCMS Vu Real-
Time Pie Chart report, you use the New Report option on the File menu to
create the report. After you have created and saved a Real-Time Pie Chart
report, you access the report using the Open Reports option on the File
menu.
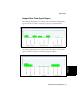
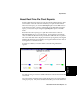
Real-Time Pie Chart reports give a quick idea of the relative values of
different BCMS items, in a pie chart format. Each segment represents the
value of a different data item and is presented in a different color or pattern.
The value of the data item is displayed next to the pie segment, and a legend
identifies the data item represented by each segment and shows the value of
each segment as a numerical value.
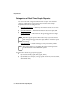
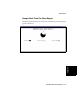
If no data is available, a window similar to the following illustration
appears.
Pie charts do not give visual or audible indication of alerts when thresholds
are reached.
You cannot select which data items will be displayed in a pie chart (unlike in
a bar graph report). Only those attributes that add up to a whole domain are