
User guide


Working with Reports
7-4 Creating a Real-Time Graph Report
6. Select Next.
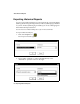
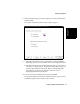
The next window that appears, which depends on the type of data you
selected on the first window, asks you to choose the attributes that you
want to measure in the report. For example, the following illustration
shows the window that appears if you chose the radio button next to
Agent summary.
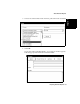
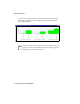
7. Select the attributes (data items) that you want to include on the display.
a. To select all items in the “Available” list, select Add All.
b. To select individual items, highlight them and select Add.
c. Use the Remove and Remove All buttons to remove attributes
that you do not want to display.