
User guide


Working with Reports
Chapter 7
Creating a Real-Time Graph Report 7-5
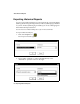
8. When all the data items you want to display are in the “Selected Items”
list select Next.
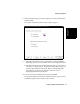
The “Select orientation of the bar chart” window appears.
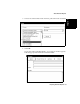
9. a. Select the radio button next to “Vertical Bars” or “Horizontal Bars,”
depending on how you want the bars in the chart to align themselves.
b. Select the radio button next to either “By split/skill” (or “By agent” or
“By VDN,” as appropriate) or “By data item” depending on how you
want the data arranged on the report. Refer to “Sample Real-Time
Graph Report” on page 5-5 for examples of the two ways of
displaying Real-Time Graph Reports.
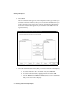
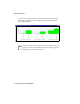
10. To close the wizard and display the report, select Finish.
The Graph Properties Wizard closes and the Real-Time Graph you have
just defined appears on the BCMS Vu main window.