
User guide

Working with Reports
7-8 Creating a Real-Time Pie Chart Report
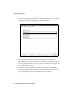
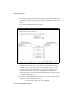
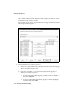
The following illustration shows the window that appears if you select
“Agent Work State for Split/Skill” in the first window.
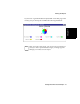
5. For an Agent Work States for Split/Skill Report or a VDN Calls
Summary Report, select a split/skill or VDN from the pull-down menu.
For an Agent Call Summary report, select a split/skill and an agent from
the two pull-down menus.
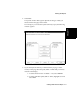
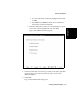
6. To close the wizard and display the Pie Chart Report, select Finish.
The Graph Properties Wizard closes and the Real-Time Pie Chart you
have just defined appears on the BCMS Vu main window.