
User guide


Working with Reports
7-2 Creating a Real-Time Graph Report
Creating a Real-Time Graph Report 7
To create a Real-Time Graph Report
1. In the File menu select New Report.
The “New” window appears.
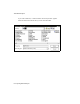
2. Select Real-Time Graph.
The “Select the type of data you wish to graph” window appears.
3. Select the radio button next to the type of data (for example, Agent summary)
that you want to show on this Real-Time Graph.
4. Select Next.