
Product specifications
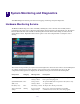

Monitoring System Connection Status
111
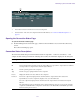
Opening the Bandwidth Page
To open the Bandwidth page:
t From the Management Console home page, click the Bandwidth icon, located in the Connectivity section.
The Bandwidth page opens.
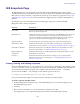
Bandwidth List
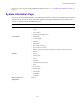
The following table describes the information displayed in the Bandwidth page.
n
To sort the information in the Bandwidth Monitor list, click any column heading. For more information on sorting
items in columns, see “Sorting Information” on page 24.
Scaling the Bandwidth List Graph Display
The Bandwidth Monitor list represents bandwidth consumption for the network and for individual system
components in the form of horizontal bars in a graph display. Numeric divisions are displayed in megabytes/second
(MB/s). You can adjust the scale of the graph to make it easier to monitor bandwidth information.
To decrease or increase the size of the graph view:
t Click Decrease Size or Increase Size button.
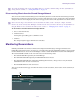
Monitoring System Connection Status
The Connection Status page allows you to view the status of all components connected to the network. You can also
use the Connection Status page to disconnect components from the system.
n
Some clients might not be able to connect to the shared storage network if the combined bandwidth requirement of
connected components equals the system limit for bandwidth use. For information on monitoring bandwidth use, see
“Monitoring Client Bandwidth” on page 110.
Heading Description
System Read Bandwidth The value of the total system bandwidth currently in use for reading files (in MB/s)
System Write Bandwidth The value of the total system bandwidth currently in use for writing to files (in MB/s)
System Name The name of the system specified during the System Director configuration
Read BW For the listed system components, the value of the bandwidth currently in use for reading files
(in MB/s)
Write BW For the listed system components, the value of the bandwidth currently in use for writing to
files (in MB/s)
Bandwidth For the listed system components, graphical display of bandwidth usage:
• Read (green bar)
• Write (red bar)