
User Manual


Table Of Contents
- Contents
- Part I: Introduction to Pro Tools
- Part II: System Configuration
- Chapter 5: Pro Tools Systems
- Pro Tools Software
- Pro Tools | Ultimate Software with Pro Tools | HDX Hardware
- Pro Tools | Ultimate Software with Pro Tools | HD Native Hardware
- Supported Pro Tools HD Audio Interfaces
- Playback, Recording, and Voice Limits with Pro Tools | Ultimate Software
- Pro Tools HD Audio Interface Features
- Additional Pro Tools Hardware Options
- Additional Pro Tools HD Hardware Options
- Pro Tools Software Options
- Avid Application Manager
- Chapter 6: I/O Setup
- Pro Tools Software Signal Paths
- I/O Setup Pages
- I/O Setup Signal Path Controls
- I/O Setup Buttons
- I/O Setup Options
- Customizing I/O Settings
- Configuring Hardware in I/O Setup
- Signal Path Routing for Audio Input
- Signal Path Routing for Audio Output
- Creating New Paths
- Creating New Sub-Paths
- Editing Paths
- Assigning Paths to Hardware I/O
- Valid Paths and Requirements
- Configuring Busses
- Downmix and Upmix Output Busses to Outputs
- I/O Settings Files
- Session or Project Interchange and I/O Mapping
- I/O Settings and the Playback Engine
- Organize Track I/O Menus By Preference
- I/O Setup in Session Notes
- Pro Tools Session Templates and I/O Settings
- Chapter 7: System Setup
- Starting Up or Shutting Down Your System
- Checking a Pro Tools | HDX or Pro Tools | HD Native System with DigiTest
- Configuring Pro Tools Software System Settings
- Configuring MIDI Setup
- Configuring Hardware Settings in Pro Tools
- Configuring Pro Tools | HDX and Pro Tools | HD Native Hardware Settings
- System Usage
- Chapter 8: Preferences
- Chapter 9: Peripherals
- Chapter 10: Configuring MIDI
- Chapter 5: Pro Tools Systems
- Part III: Sessions, Projects & Tracks
- Chapter 11: Sessions and Projects
- Sessions and Projects
- Signing In and Out of Your Avid Master Account
- Dashboard Window
- Bit Depths and Sample Rates
- Mixed Audio File Formats
- Interleaved Multichannel and Multi-Mono Audio Files
- Session Files and Folders
- Pro Tools Projects
- Creating a New Session or Project from a Template
- Creating a New Blank Session or Project
- Opening a Recent Session or Project
- Opening Any Session
- Opening a Session
- Opening a Session or Project with Plug-Ins Deactivated
- Saving Sessions and Projects
- Save Copy In
- Save As New Version
- Revision History
- Saving a Session as a Project
- Saving a Project as a Session
- Session Templates
- Project and Session Metadata
- Project Notes
- Closing a Session or Project
- Renaming Projects
- Remove Local Cache
- Deleting Projects
- Restore Project from Cloud
- Open Revision History
- Backup to Cloud
- Project Collaboration Invitations in the Dashboard
- Quitting or Exiting Pro Tools
- Chapter 12: Pro Tools Main Windows
- Chapter 13: Tracks
- Track Types
- Track Channel Strips in the Mix Window
- Track Controls and Indicators in the Edit Window
- Edit Window Views
- Track Level Meters
- Adjusting Track Width
- Creating Tracks
- Track Views
- Setting Track Views in the Edit Window
- Track Height
- Tracks List
- Track Name Right-Click Menu
- Assigning Audio Inputs and Outputs to Tracks
- Track Priority and Voice Assignment
- Assigning MIDI Inputs and Outputs to Tracks
- Soloing and Muting Tracks
- Making Tracks Inactive
- Color Coding for Tracks, Clips, Markers, and Groups
- Chapter 14: Track Presets
- Chapter 15: Grouping Tracks
- Chapter 16: The Clips List
- Chapter 17: Workspace Browsers
- Performance and Transfer Volumes
- Databases
- Workspace Browser Layout and Tools
- Working with Items in Workspace Browsers
- Indexing Workspace Databases
- Workspace Browser Menu
- Workspace Right-Click Menu
- Workspace Browser Panes and Display
- Column Data
- Selecting Items
- Moving, Copying, Duplicating, and Removing Items
- Set Column Metadata Values for Multiple Selected Files in Workspace Browsers
- Searching Items
- Soundbase and Tags
- Searching Based on Tags
- Adding and Editing Tags
- Waveforms
- Elastic Audio Files in the Workspace
- Previewing Audio in Workspace Browsers
- Preview Controls and Indicators
- Preview Modes
- Linking and Relinking Files
- Transfer Files
- Missing Files
- Relink Window
- Catalogs
- Task Manager Window
- Chapter 18: Artist Chat Window
- Profile Setup
- Contacts
- Notifications
- History
- Projects
- Chat
- Filtering Chat and Project Messages
- Editing Chat or Project Messages
- Emoticon and Notations Panel
- Pinning or Unpinning Items in the Projects and Chat Lists
- Leaving a Project or Group Chat
- Move to or Restore from Artist Chat History
- Remaining Signed In to your Avid Account Offline
- Availability for Participation
- Chapter 19: Track Collaboration
- Sharing Projects and Collaborating
- What is Shared?
- What is Not Shared?
- Project Ownership
- Start Collaboration
- Track Collaboration Tools in the Edit Window
- Track Collaboration Tools in the Transport Window
- Global Track Collaboration Tools
- Track Collaboration Track View in the Edit and Mix Windows
- Track Collaboration Controls
- Track Ownership
- Conflicts Between Track Changes and the Cloud
- Track Cloud Synchronization Indicator in the Tracks List
- Conductor Ruler Collaboration Controls
- Chapter 20: Importing and Exporting Session Data
- Importing and Exporting Data to and from a Session or Project
- Audio Conversion on Import
- Importing Files with Drag and Drop
- Importing Audio Files and Clips Using the Import Audio Command
- Importing Audio from Audio CDs
- Importing ACID and REX Files
- Importing Multichannel Audio Files from a Field Recorder
- Import Options and Preferences
- Exporting Audio
- Importing MIDI Files
- Exporting MIDI Files
- Exporting Sibelius Files
- Importing Session Data
- Import Session Data Dialog
- Importing AAF and OMF Sequences
- Import Options when Importing AAF or OMF Sequences
- Import Sequence from Media Production
- Media Composer | Software Export Options for Audio and Video Mixdowns
- Audio File Format Compatibility Issues
- Exporting Pro Tools Tracks as AAF or OMF Sequences
- Exporting Pro Tools Tracks as MXF Audio Files
- Export Options when Exporting to AAF or OMF Sequences
- Export Selected Tracks to Sequence in Production Management
- Export Selected Tracks as New Session or Project
- Exporting Session Information as Text
- Export Session Information as Text Options
- Importing and Exporting Clip Group Files
- Chapter 21: File and Session Management and Compatibility
- Audio File Management
- WAV File Compatibility
- Sharing Projects Offline
- Sharing Sessions Created on Different Computer Platforms
- Sharing Sessions Created on Different Pro Tools Systems
- Opening Pro Tools Ultimate Sessions in Pro Tools
- Sharing Sessions Created on Different Pro Tools Software Versions
- Language Compatibility
- Chapter 11: Sessions and Projects
- Part IV: Playback and Recording
- Chapter 22: Playing Back Track Material
- Chapter 23: Record Setup
- Record Setup Overview
- Configuring Pro Tools Hardware I/O for Recording
- Connecting a Sound Source
- Recording with a Click
- Setting the Session Meter and Tempo
- Record Modes
- Configuring Default Names for Audio Files and Clips
- Assigning Hardware I/O on a Track
- Record Enabling Tracks
- Working with Hard Drives for Recording
- Selecting a Record Input Monitoring Mode
- Setting Monitor Levels for Record and Playback
- Reducing Monitoring Latency
- Chapter 24: Audio Recording
- Chapter 25: MIDI Recording
- Recording from MIDI Devices
- Enabling Input Devices
- MIDI Thru
- MIDI Input Filter
- Input Quantize
- Wait for Note
- MIDI Merge/Replace
- Configuring MIDI or Instrument Tracks for Recording
- Recording MIDI and Instrument Tracks
- MIDI Input Display
- MIDI Punch Recording Over a Specified Range
- Loop Recording MIDI
- MIDI Step Input
- Recording System Exclusive Data
- Recording Audio from a MIDI Instrument
- Retrospective Record for MIDI
- Chapter 26: Punch Recording Modes
- Part V: Editing
- Chapter 27: Editing Basics
- Chapter 28: Edit Modes and Tools
- Edit Modes
- Shuffle Mode
- Slip Mode
- Spot Mode
- Grid Mode
- Edit Tools
- Zooming Options
- Zoom Buttons
- Zoomer Tool
- Zoom Preset Buttons
- Zoom Toggle
- Zooming with a Scroll Wheel
- Using the Trim Tools
- Trim Tool
- Time Compression/ Expansion Trim Tool
- Scrub Trim Tool
- Loop Trim Tool
- Tandem Trimming
- Using the Selector Tool
- Using the Grabber Tools
- Using the Smart Tool
- Using the Scrubber Tool
- Numeric Keypad Set to Shuttle
- Using the Pencil Tool
- Edit/Tool Mode Keyboard Lock
- Chapter 29: Making Selections
- Chapter 30: Editing Clips and Selections
- Creating New Clips
- Healing Separated Clips
- Trimming Clips
- Nudging Clips
- Layered Editing
- Quantizing Clips to Grid
- Editing Stereo and Multichannel Tracks
- Consolidating Clips
- Compacting an Audio File
- Processing Audio with AudioSuite Plug-Ins
- TCE (Time Compression and Expansion) Edit To Timeline Selection
- Rating Clips
- Chapter 31: Fades and Crossfades
- About Crossfades and Curves
- Fade Dialogs
- Fade and Crossfade Preferences
- Fade Presets
- Creating Fades at the Beginnings and Ends of Clips
- Creating a Crossfade
- Using AutoFades
- Creating Fades and Crossfades in Batches
- Manually Adjusting Fade Shapes in Fade Windows
- Adjusting the Start and End Points of a Crossfade
- Adjusting Fade Shapes with the Smart Tool in the Edit Window
- Changing Fade Shapes in the Edit Window
- Fades Options in the Edit Selection Right-Click Menu
- Moving and Nudging Fades and Crossfades
- Separating Clips that Include Fades or Crossfades
- Trimming Clips that Include Fades or Crossfades
- Fade Boundaries and Shapes Displayed in Automation View
- Chapter 32: Playlists
- Working with Playlists
- Track Compositing
- Playlists View
- Matching Alternate Clips
- Matching Criteria Options
- Selecting Alternate Takes on Tracks
- Automatically Create New Playlists when Loop Recording
- Expanding Alternate Takes to New Playlists or Tracks
- Expanding Alternate Channels to New Playlists or Tracks
- Target Playlist
- Track Compositing Keyboard Shortcuts
- Chapter 33: Beat Detective
- Beat Detective and Source Material
- Uses for Beat Detective
- Beat Detective Requirements
- The Beat Detective Window
- Beat Detective Modes
- Defining a Beat Detective Selection
- Beat Detective Analysis
- Calculating Tempo with Beat Detective
- Generating Beat Triggers
- Editing Beat Triggers
- Generating Bar|Beat Markers with Beat Detective
- DigiGroove Templates
- Separating Clips with Beat Detective
- Conforming Clips with Beat Detective
- Edit Smoothing
- Detection (Normal) and Collection Mode
- Part VI: MIDI
- Chapter 34: MIDI Editing
- MIDI Editing Options
- Setting the Grid Value
- Using the Pencil Tool
- Inserting MIDI Notes
- Inserting a Series of Notes
- Manually Editing MIDI Notes
- Using the Grabber Tools
- Time Compression/ Expansion Trim Tool Functionality on MIDI Clips
- Continuous Controller Events
- Keyboard Shortcuts for Navigating MIDI
- Patch Select (Program and Bank Changes)
- System Exclusive Events
- Note and Controller Chasing
- Offsetting MIDI Tracks
- Stuck Notes
- Remove Duplicate Notes
- MIDI Real-Time Properties
- Real-Time Properties Settings
- Real-Time Properties on Tracks and Clips
- Writing Real-Time Properties to Tracks or Clips
- Real-Time Properties In the MIDI Event List
- Display of Real-Time Properties Effects
- Chapter 35: MIDI Editors
- Chapter 36: Score Editor
- Opening the Score Editor Window
- Edit Tools
- Default Note Duration
- Default Note On Velocity
- Play MIDI Notes When Editing
- Link Timeline and Edit Selection
- Mirrored MIDI Editing
- Double Bar
- Cursor Location
- Grid
- Score Editor Window Target
- Score Editor Window Menu
- Tracks List
- Page Controls
- Score Editor Zoom Controls
- Notation Display Track Settings
- Score Setup
- Editing Notes
- Score Editor Right-Click Menu
- Key Changes
- Meter Changes
- Chord Symbols and Diagrams
- Exporting Scores
- Printing Scores
- Chapter 37: MIDI Event List
- Chapter 34: MIDI Editing
- Part VII: Arranging
- Chapter 38: Time, Tempo, Meter, Key, and Chords
- Timebase Rulers and Conductor Rulers
- Main Time Scale
- The Sub Counter
- Tick-Based Timing
- Tick- and Sample-Based Timebases
- Song Start Marker
- Tempo
- Graphic Tempo Editor
- Editing Tempo Events in the Tempo Editor
- Changing the Linearity Display Mode
- Tempo Operations Window
- Identify Beat Command
- Meter Events
- Time Operations
- Change Meter
- Insert Time
- Cut Time
- Move Song Start
- Renumbering Bars
- Key Signatures
- Chord Symbols
- Extract Chords From Selection
- Chapter 39: Memory Locations
- Chapter 40: Arranging Clips
- Placing Clips from the Clips List on to Track Playlists
- Working with Multiple Items from the Clips List
- Placing Clips at the Edit Insertion Point
- Aligning Clips with the Edit Insertion Point
- Arranging with Transparent Clip Overlays
- Moving Clips with the Grabber Tools
- Layered Editing
- Snapping to the Preceding or Next Clip on a Track
- Arranging Clips in Shuffle Mode
- Arranging Clips in Slip Mode
- Spotting Clips
- Arranging Clips in Grid Mode
- Replacing Audio Clips
- Sync Points
- Shift Command
- Locking Clips
- Muting/Unmuting Clips
- Stripping Silence from Clips
- Inserting Silence
- Duplicating Clips
- Repeating Clips
- Chapter 41: Clip Loops and Groups
- Clip Looping
- Creating Looped Clips
- Unlooping Clips
- Editing Looped Clips
- Clip Groups
- Creating Clip Groups
- Ungrouping Clips
- Regrouping Clips
- Multitrack Clip Groups
- Clip Groups on Tick-Based Tracks
- Editing Clip Groups
- Fades and Crossfades on Clip Groups
- Clip Groups and Clip Gain
- Importing and Exporting Clip Group Files
- Chapter 38: Time, Tempo, Meter, Key, and Chords
- Part VIII: Processing
- Chapter 42: AudioSuite Processing
- Chapter 43: Clip Gain and Clip Effects
- Chapter 44: Elastic Audio
- Example Elastic Audio Workflow
- Elastic Audio Tracks
- Disabling Elastic Audio Tracks
- Elastic Audio Track Controls
- Elastic Audio Track Views
- Elastic Audio Analysis
- Real-Time and Rendered Elastic Audio Processing
- Elastic Audio Plug-Ins
- Editing in Warp View
- Warping Audio
- Editing in Analysis View
- Elastic Properties
- Elastic Properties Window
- Elastic Audio Clip-Based Pitch Shifting
- AudioSuite Processing and Elastic Audio Clips
- Moving Elastic Audio Between Tracks
- Approximate Waveforms
- Elastic Audio Preferences
- Chapter 45: Committing, Freezing, and Bouncing Tracks
- Chapter 46: Event Operations
- Chapter 47: HEAT
- Part IX: Mixing
- Chapter 48: Basic Mixing
- Mixing Concepts
- Metering and Calibration
- Signal Flow by Track Type
- Audio Tracks and Signal Flow
- Auxiliary Input Tracks and Signal Flow
- Master Fader Tracks and Signal Flow
- Instrument Tracks and Signal Flow
- VCA Master Tracks
- Inserts
- Configuring Inserts View in the Mix and Edit Windows
- HEAT
- Stereo Pan Depth
- Views in the Mix and Edit Windows
- Audio Input and Output Paths
- Sends
- Configuring Sends View in the Mix and Edit Windows
- Sends View Options
- Editing Sends in the Mix and Edit Windows (Individual Send Views)
- Bus Interrogation Options
- Output Windows for Tracks and Sends
- Output Meters
- Signal Routing for Monitoring and Submixing
- Delay Compensation
- Dither
- Using an Ethernet Control Surface with Pro Tools
- Using a MIDI Control Surface with Pro Tools
- Chapter 49: Plug-In and Hardware Inserts
- Types of Inserts
- Viewing Inserts
- Making Inserts Inactive
- Inserting Plug-Ins on Tracks
- Plug-In Menu Organization
- Plug-in Insert Search
- Default EQ and Dynamics Plug-Ins
- Plug-In Favorites
- Moving and Duplicating Plug-In and Hardware Inserts
- Plug-In Windows
- Opening Plug-In Windows
- Using Plug-In Window Controls
- Editing Plug-In Controls
- Plug-In Automation and Safe Modes
- Side-Chain Input
- Plug-in Bus Outputs
- Plug-In Presets
- Plug-In Settings Dialog
- Plug-In Mapping
- Bypassing Plug-Ins
- Linking and Unlinking Controls on Multi-Mono Plug-Ins
- Using Hardware Inserts
- Chapter 50: Automation
- Automation Overview
- Automation Playlists
- Automation Modes
- Automation Preferences
- Viewing Automation
- Indication of Automation in Track View and Automation Lane Selectors
- Writing Automation
- Automating Sends
- Automating Plug-Ins
- AutoMatching Controls
- Priming Controls for Writing Automation in Latch Mode
- Enabling and Suspending Automation
- Deleting Automation
- Thinning Automation
- Drawing Automation
- Editing Automation
- Cutting, Copying, and Pasting Automation
- Glide Automation
- Trimming Automation
- Writing Automation to the Start, End, or All of a Track or Selection
- Writing Automation to the Next Breakpoint or to the Punch Point
- Guidelines for “Write To” Commands
- Overwriting or Extending Mute Automation
- Creating Snapshot Automation
- Previewing Automation
- Capturing Automation
- VCA Master Track Automation
- Coalescing VCA Automation
- Chapter 51: Mixdown
- Chapter 48: Basic Mixing
- Part X: Surround
- Chapter 52: Pro Tools Setup for Surround
- Chapter 53: Multichannel Tracks and Signal Routing
- Chapter 54: Surround Panning and Mixing
- Chapter 55: Mixing to Dolby Atmos
- Dolby Atmos Overview
- Installing and Configuring Dolby Atmos Software and Hardware
- 7.0.2 and 7.1.2 Surround Formats in Pro Tools
- Configuring the Network Connection for Pro Tools and a Dolby Atmos Renderer
- Pro Tools Restrictions when Mixing to Dolby Atmos
- Configuring Session Setup for Dolby Atmos
- Configuring the I/O Setup for Dolby Atmos
- Mixing Bed Material
- Mapping Busses to Objects
- Track Object Output Assignment
- Monitoring Object Audio when not Connected to a Renderer
- Object View in the Edit and Mix Windows
- Object Controls
- 7.0.2, 7.1.2, and Object Panner
- Object/Bus Toggle Automation
- Auto-Height Overrides Height Automation Option
- Coalesce Pan Guide Automation
- Duplicating Object Track Pan Automation and Dolby Atmos Panner Plug-in Automation
- Object Controls Mix Attribute for Grouped Tracks
- Importing Object-Related Track Data from Another Session
- Import ADM files
- Dolby Atmos PEC/DIR Recorder Workflow Example
- Chapter 56: Ambisonics
- Part XI: Sync and Video
- Chapter 57: Working with Synchronization
- Pro Tools Synchronization Options
- Session Setup Window
- Format Displays and Controls in the Session Setup Window
- SYNC Setup and Timecode Offsets in the Session Setup Window
- Timecode Settings in the Session Setup Window
- Preparing to Work with SMPTE
- Configuring Pro Tools for SMPTE
- Pull Up and Pull Down
- Effect of Using Pull Up or Pull Down
- Generating Timecode
- Using MIDI Machine Control
- Enabling MIDI Machine Control in Pro Tools
- MMC Transport Settings
- Setting Minimum Sync Delay
- Remote Track Arming
- Spotting Clips to SMPTE Frame Locations
- The Spot Dialog
- Capturing Timecode
- Auto-Spotting Clips
- Using the Trim Tools in Spot Mode
- Time Stamping
- Identifying a Synchronization Point
- Troubleshooting SMPTE Synchronization
- Speed Correction for Film, NTSC Video, and PAL Video
- Chapter 58: MachineControl
- MachineControl Requirements
- Cables and Connections
- Connecting Machines
- Starting Up Your System
- MachineControl Communication Modes
- Setting Up Machine Control
- Serial Deck Control Mode
- Configuring Serial Deck Control (Overview)
- Configuring a MachineControl Device for Deck Control
- Preferences for Serial Deck Control Mode
- Session Setup Window and MachineControl
- Additional Pro Tools MachineControl Commands
- Selecting Pro Tools or the Machine as the Transport Master
- Playback in Serial Deck Control Mode
- Remote Track Arming
- Configuring Track Arming
- Creating a Track Arming Profile
- Arming Tracks Remotely for Layback
- Remote 9-Pin Deck Emulation Mode
- Configuring Remote 9-Pin Deck Emulation Mode
- Preferences for Remote 9-Pin Deck Emulation Mode
- Playback in Remote 9-Pin Deck Emulation Mode
- Recording in Remote 9-Pin Deck Emulation Mode
- Track Arming in Remote 9-Pin Deck Emulation Mode
- Using a Paddle Device in Local Mode
- Connecting a Supported Third-Party Paddle Device to Your Pro Tools System
- Allow Track Arm Commands in Local Mode Preference
- Configuring Ports for a Deck and a Supported Third-Party Paddle Device
- Deck Control Key Commands
- Machine IDs
- 9-Pin Cable Pinouts
- Chapter 59: Working with Field Recorders in Pro Tools
- Field Recorder and Production Workflow Terminology
- Supported Field Recorder Audio Files and Metadata
- Displaying Field Recorder Metadata in Pro Tools
- Workspace Support for Field Recorder Metadata
- Field Recorder Workflows
- Ensuring Metadata of Source Files Have Been Preserved
- Receiving Source Files
- Importing Source Files into Pro Tools
- Designating Field Recorder Tracks
- Displaying Multichannel Files from a Field Recorder in the Clips List
- Selecting a Matching Field Recorder Channel to Replace a Clip
- Expanding Matching Field Recorder Channels to New Tracks
- Determining the Method of Expanding Matching Field Recorder Channels to New Tracks
- Film Workflow
- Video and Fully Non-Linear Workflows
- Chapter 60: Working with Video in Pro Tools
- Avid Video Engine (AVE)
- QuickTime Movie Support in Pro Tools
- Before Starting Your Project
- Pro Tools Video Preferences
- Video Tracks
- Main Video Track
- Video Track Controls and Indicators
- Video Track Settings
- Locking Video Tracks
- Video Engine Rate
- Importing Video into Pro Tools
- Configuring Video Import Options
- Importing Audio from a QuickTime Video Clip
- Video Clips
- Showing or Hiding Video Clips in the Clips List
- General Video Editing
- Renaming Video Disk Files
- Video Clip Groups
- Using the Video Window
- Browsing Video in the Video Universe Window
- Playback of High-Definition Video
- Optimized Video Playback
- Tips for Optimizing Video Playback
- Compensating for Video Monitoring Delays
- Playing Video to an External Monitor Using a Video Peripheral
- Bouncing the Video Track to a QuickTime Movie
- Chapter 57: Working with Synchronization
- Part XII: Satellite Systems
- Chapter 61: Satellite Link
- Chapter 62: Pro Tools Video Satellite
- Chapter 63: Avid Video Satellite
- Video Output Options
- Supported Video Resolutions
- Avid Video Satellite Workflows
- Using a Video Satellite in a MediaCentral | Production Management Environment
- Connecting Pro Tools and a Video Satellite
- Matching Media Composer and Pro Tools Settings in a Video Satellite System
- Linking or Unlinking Pro Tools and a Video Satellite
- Capturing Audio and Video with a Video Satellite System
- Re-Digitizing an Existing Sequence
- Digitizing from an EDL
- Laying Back Audio and Video to Tape
- Index
Chapter 7: System Setup 103
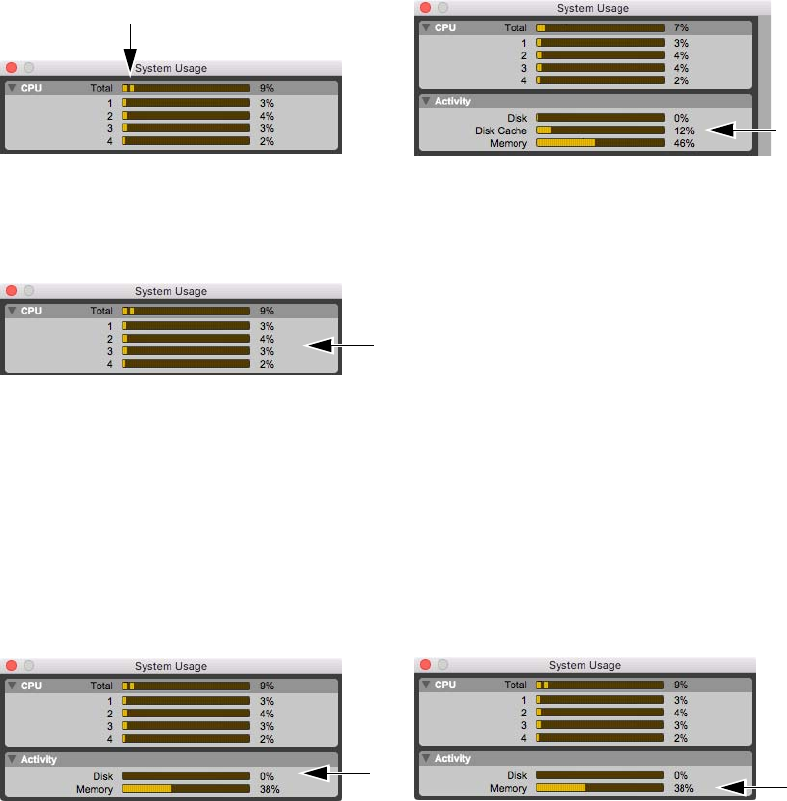
CPU Meters
The CPU Total meter displays session performance
for Elastic Audio processing, Clip Gain process-
ing, and Native plug-in and mixer processing. A
3-second peak indicator provides visual indication
of peak CPU usage.
The individual
CPU meters provide a general indi-
cation of how much Pro Tools is using each of the
processors in your computer.
Activity Meters
The Activity section of the System Usage window
display meters for disk usage and memory usage.
Disk Meter
As in previous versions of Pro Tools, the Disk me-
ter displays the amount of hard disk processing ac-
tivity.
Disk Cache Meter
The System Usage window lets you monitor use of
the Disk Cache. This meter is only present if a
fixed
Cache Size is selected in the Playback En-
gine dialog.
The Disk Cache meter
indicates the amount of al-
located
memory being used to cache audio in the
timeline (up to the amount of RAM selected for the
Disk Cache setting in the Playback Engine). An
additional peak-meter style indicator
is included to
show how
much of the allocated RAM is needed
for caching
the session.
Memory Meter
The Memory meter displays how much of the in-
stalled physical RAM in the system is being used
by Pro Tools. This includes RAM used by the au-
dio engine, the video engine (if enabled), plug-ins,
and the disk cache. Other than Pro Tools, it does
not show any other RAM usage by the system. If
the Memory meter approached 100%, install more
physical RAM or lower the Disk Cache setting in
the Playback Engine dialog.
System Usage window, CPU peak meter indicator
System Usage window, individual CPU meters
System Usage window, Disk meter
System Usage window, Disk Cache meter
System Usage window, Memory meter