
User manual
260
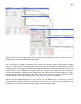
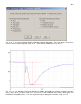
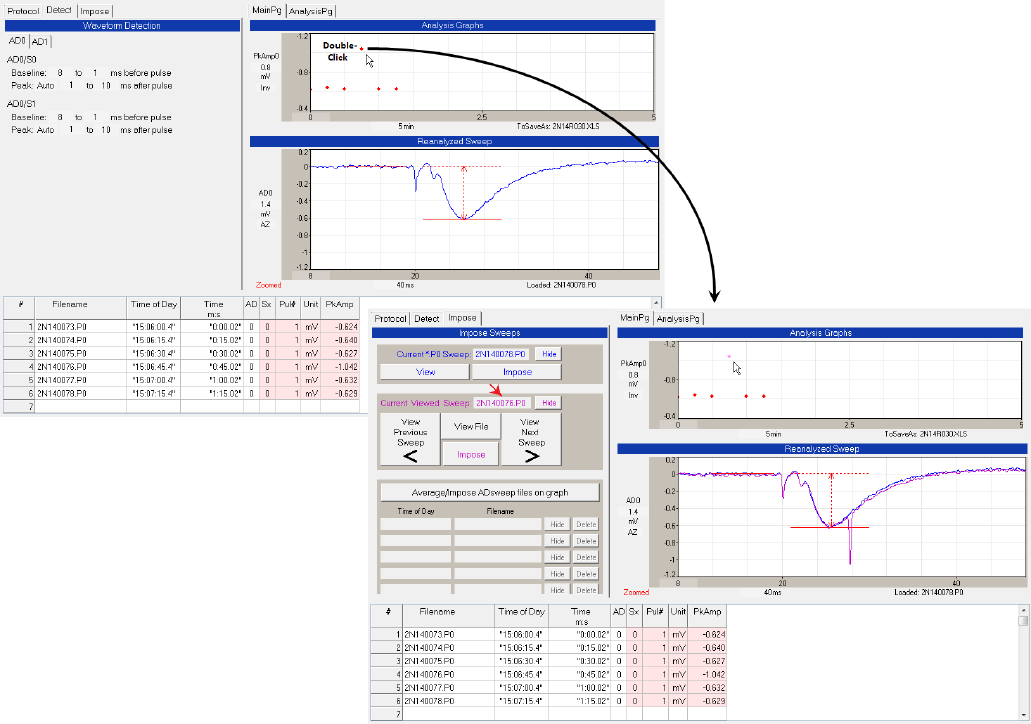
Fig. 15.9.2. . When an Analysis Graph data point is clicked to View a sweep, the entire ‘Impose’ tabsheet
appears (left side of lower right panel), and the filename of the ADsweep file of that Viewed sweep also
appears as the ‘Current Viewed Sweep’ (red arrow).
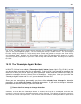
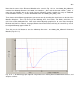
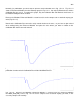
Fig. 15.9.3 shows an example of averaging all the sweeps in the baseline (prior to LTD induction), plotting
them as a single orange trace, printing the ‘Time of Day’ of the last sweep and first sweep in orange,
saving this file as an averaged *.AP0 file, and printing this filename in orange in the ‘Filename’ field. This
filename consists of the YMDD the file number of the last sweep, the file number of the first sweep and
the ‘AP0’ file extension. Similarly, all the sweeps after LTD induction were averaged, plotted as a single
cyan trace (and arrow), printed in cyan in the ‘Time of Day’ field, saved as an averaged *.AP0 file, and the
filename printed in cyan in the ‘Filename’ field. (See also Section 5.4 for more details.)
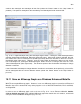
Note that the AZ AutoZeroing ACoffset is only set when an new ADsweep file is reanalysed, or when a
View Sweep file or Imposed sweep file is loaded, and in each case, it is the first 5% of the sweep (or up to
first 100 msec of sweep) for either the Zoomed graph or the Unzoomed graph.