
User manual


55
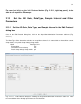
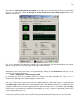
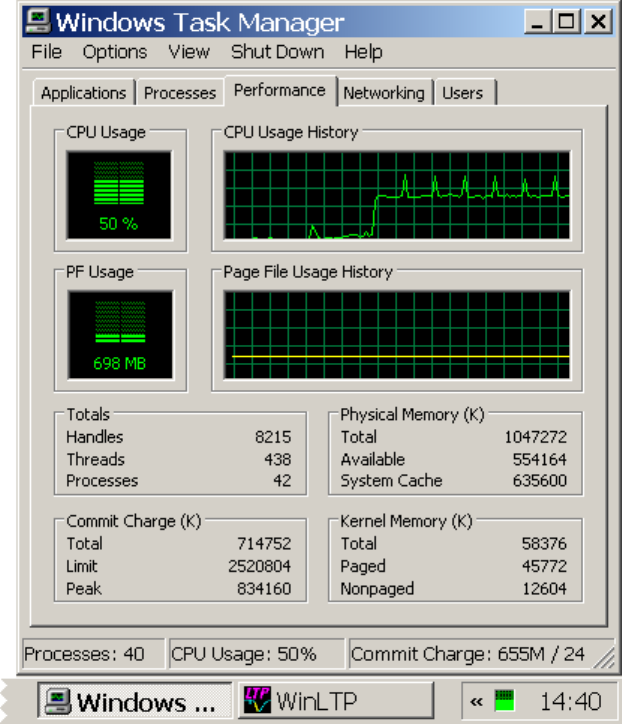
Also note the small green CPU Usage Graph on the right of the Task Bar which concisely shows CPU
usage as a % full usage. This can be kept on screen all the time to show CPU usage (with the Task
Manager minimized).
Fig. 2.17.2. Windows Task Manager showing CPU usage graphically after the MainProtocol was started.
Note the small green CPU Usage Graph on the right of the Task Bar.
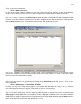
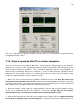
Alternatively, CPU usage can also be seen graphically by clicking on the Performance tab (Fig. 2.17.2)
and then use the menu command:
View -> CPU History -> One Graph per CPU
to view how each CPU of a multicore processor is being used (again, Windows XP, Vista, 7 or 8, a
Pentium CPU with HyperThreading will appear as two CPUs).
Fig. 2.17.3 shows CPU usage increase when the Main Protocol is started and reaches a moderately low
total CPU usage of about 15% when running WinLTP with a PCI M-Series board on a 2.4 GHz dual-core
computer (2AD channels at 50us sampling interval, Repeat Sweeps of 0.1 sec duration with no delay
between them, and Continuous Acquisition, with plotting on screen). Note the substantially smaller CPU
usage compared to Fig. 2.17.2.
If a quad-core processor was used, the CPU Usage History would contain 4 panels, one for each CPU.