
User manual
70
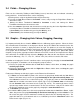
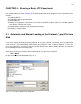
3.4 Fields – Changing Values
Fields can be selected by Tabbing or Shift-Tabbing (reverse) into them, and are indicated selected by
turning dark blue. Selected field values can be changed by:
1) Entering values using the keyboard and pressing the Enter key
2) Pressing the Left Mouse Button to increment a value, and pressing the Right Mouse Button to
decrement a value.
3) Moving the Mouse Thumbwheel forward to increment a value, and moving the Mouse
Thumbwheel backwards to decrement a value.
4) Also, the amount of increment and decrement caused by pressing the Left or Right Mouse Button,
or moving the Mouse Thumbwheel forward or backward can be:
a) Increased by also simultaneously pressing the Shift key, and
b) Decreased by also simultaneously pressing the Ctrl key
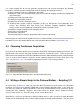
3.5 Graphs – Changing Axis Values, Dragging, Zooming
It is important to briefly discuss how the AZ/DC field in the ADsweep graphs operates. When the field is
AZ, or AutoZeroed, the waveform is not high pass filtered, but the first 20th of the waveform (or the first
100 msec, whichever is shorter) is displayed at 0 mV or 0 pA. This produces an ersatz 'AC coupling' or
AutoZeroing of the waveform, and allows small signals with large slow voltage fluctuations to be displayed
in the graph, but the waveform is not at all distorted by high pass filtering and is plotted DC ('Direct
Coupled') except for the superimposed offset. When the field is DC, no offsets are imposed on the display
of the waveform. The AZ/DC field only affects the display of the data and does not affect the data values
saved in the ADsweep (*.T0, *.T1, *.P0, *.P1, *.AP0 or *.AP1) files, which are saved as DC values.
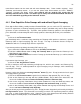
In addition to changing the X and Y coordinate values on the graphs by changing the associated field
values, the graph X, Y coordinates can be changed by using the mouse:
1) Click on the graph data window with the Left Mouse Button, hold it down, and drag the graph
vertically up or down.
2) Click on the graph data window with the Right Mouse Button, hold it down, and drag the graph
horizontally left or right.
Furthermore, ADsweep and Analysis graphs can be Zoomed and Unzoomed.
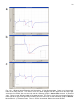
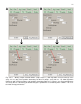
1) To Zoom, first hold the Ctrl key down, then click on the graph data window with the Left Mouse
Button, hold it down, drag it across the graph horizontally to the right and vertically down, and
then release it to zoom in on a section of the graph. The graph goes from an initial Non-Zoomed
state with no red label in the lower left axis region (Fig 3.5.1a) to a Zoomed state as indicated by
the red “Zoomed” label in the lower left axis region (Fig. 3.5.1b). This zooming by mouse can be
repeated any number of times to zoom further in on the area of interest. And you can further refine
the X and Y coordinate values on the graphs by changing the associated field values.
2) To Unzooom, you can either:
a) first hold the Ctrl key down, then click on the graph data window with the Left Mouse Button, hold it
down, drag it across the graph horizontally to the left and vertically up, and then release it. This
will restore the graph X and Y coordinates to what they were before the zooming took place. The
graph will now be in an Unzoomed state as as indicated by the black “Unzoomed” label in the
lower left axis region (Fig. 3.5.1c).