
User manual

Historical Views
Your IHD presents your historical usage for the last 24 hours and for the last 30 days to enable you to detect
trends in your usage patterns, and to provide feedback on your energy conservation efforts over a period of
time.
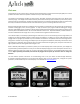
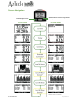
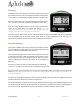
Last 24 Hour Historical Views
Each of the 24 vertical bars represents one hour.
As the day progresses, the graph adjusts so that the most recent
24 hours of data is always displayed. When a new bar of data is
added to the right side of the graph each hour, the oldest data is
removed from the left side.
Daylight hours (6AM to 6PM) are identified by the sun icon and
nighttime hours (6PM to 6AM) are identified by the moon icon.
Press the mode button to switch between the cost ($) or usage
(kWh) views of your historical energy consumption.
`
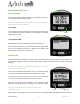
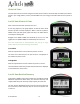
In Cost Mode
Each bar represents the cost of electricity used in one hour.
The total cost of electricity for the past 24 hours is displayed on
the bottom line of the screen.
In Usage Mode
Each bar represents the amount of electricity used in one hour.
The total amount of electricity used for the past 24 hours is displayed
on the bottom line of the screen.
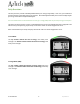
Last 24 Hour Detailed Summary
If your home is billed on a time of use (TOU) rate, your IHD can provide
additional information about when you consume electricity and
insights about how your electricity usage impacts your total cost.
The Last 24 Hour Detailed Summary presents how much electricity
was consumed in each electricity rate tier and the respective cost
in each tier.
D 097-0905 B01 10 myaztech.ca