
User Manual
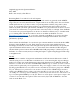
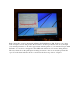


The Radio Jove is a fairly low powered box. The box on top is a 25 K (kelvin) noise source when
turned on and becomes a band-pass filter to reduce SW broadcast interference. I used a HP signal
generator to verify the settings and the weak signal response. I could see a signal as low as a 0.1
microvolt. To avoid power noise, I also use a well-regulated 12 volt DC wall-wart power supply
to drive both units.
The Software
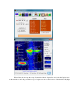
The Radio-Skypipe II software converts the audio signals into a digital reading and creates a
digital strip chart. The software has been around for a number of years and is fairly easy to use. It
can build daily charts and display shorter time spans as needed. It has a calibrator mode that was
designed to accommodate the receiver. Its wizard takes you through the Radio Jove setup and
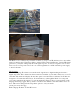
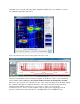
even scales and labels the vertical ‘Y’ axis automatically. Figure 5 shows a screen picture of the
Skypipe data being logged. The top chart is a 24 hour view and the lower chart I have set for an
hour. This can be changed in the strip charts options to suit your needs.
(insert pix: screen shot.jpg)
Radio Skypipe II charts on mini-PC screen.