Model: 2530B, 2532B 25 MHz & 40 MHz Digital Storage Oscilloscope USER MANUAL
Safety Summary The following safety precautions apply to both operating and maintenance personnel and must be observed during all phases of operation, service, and repair of this instrument. Before applying power, follow the installation instructions and become familiar with the operating instructions for this instrument. If this device is damaged or something is missing, contact the place of purchase immediately.
Do not attempt any internal service or adjustment unless another person, capable of rendering first aid and resuscitation, is present. DO NOT SUBSTITUTE PARTS OR MODIFY THE INSTRUMENT Do not install substitute parts or perform any unauthorized modifications to this instrument. Return the instrument to B&K Precision for service and repair to ensure that safety features are maintained.
Compliance Statements Disposal of Old Electrical & Electronic Equipment (Applicable in the European Union and other European countries with separate collection systems) This product is subject to Directive 2002/96/EC of the European Parliament and the Council of the European Union on waste electrical and electronic equipment (WEEE) , and in jurisdictions adopting that Directive, is marked as being put on the market after August 13, 2005, and should not be disposed of as unsorted municipal waste.
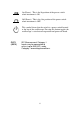
On (Power). This is the In position of the power switch when instrument is ON. Off (Power). This is the Out position of the power switch when instrument is OFF. This symbol shows that the switch is a power switch located at the top of the oscilloscope. Pressing this button toggles the oscilloscope’s state between operation and power off mode. CAT I (400V) IEC Measurement Category I. Inputs may be connected to mains (up to 400 VAC) under Category I overvoltage conditions.
Table of Contents SAFETY SUMMARY...................................................................... 3 CHAPTER 1 INTRODUCTION....................................................... 10 PANEL AND DISPLAY INFORMATION .................................................... 11 Front Panel ........................................................................................ 11 Back and Side Panel .......................................................................... 12 Display Information ..................
Signal Source ..................................................................................... 61 Trigger Type ...................................................................................... 61 Coupling ............................................................................................ 81 Position ............................................................................................. 81 Slope and Level ...............................................................................
APPLICATION OF X-Y FUNCTION....................................................... 168 ANALYZING A DIFFERENTIAL COMMUNICATION SIGNAL ....................... 170 CHAPTER 4 MESSAGE PROMPTS AND TROUBLESHOOTING....... 172 MESSAGE PROMPTS ...................................................................... 172 TROUBLESHOOTING ....................................................................... 174 CHAPTER 5 SPECIFICATIONS .................................................... 177 SPECIFICATIONS...............
Chapter 1 Introduction The 2530B/2532B digital storage oscilloscopes (DSO) are portable benchtop instruments used for making measurements of signals and waveforms.
Panel and Display Information Front Panel It is important for you to understand the DSO’s front panel before operating it. The following contents are a brief introduction for the front panel function, which is useful to become familiar with the operation of the 2530B/2532B DSO.
1. 2. 3. 4. 5. 6. 7. 8. 9. 10. 11. 12. 13. 14. 15. 16. 17. 18.
6 7 2 1 3 4 Figure 2 - Back Panel 1. 2. 3. 4. 5. 6. 7. Side ventilation fan Pass/Fail output RS-232 Port USB interface port (for remote connection to EasyScope software) AC line input (100~240 V, 45-440 Hz, max.
5 Figure 3 - Side Panel 14
Display Information Figure 4 - Display Screen 1. Trigger status • Armed - The oscilloscope is acquiring pre-trigger data. All triggers are ignored in this state. • Ready - All pre-trigger data has been acquired and the oscilloscope is ready to accept a trigger. • Trig’d - The oscilloscope has seen a trigger and is acquiring the post-trigger data. • Stop - The oscilloscope has stopped acquiring waveform data. • Auto - The oscilloscope is in auto mode and is acquiring waveforms in the absence of triggers.
2. 3. 4. occurs when oscilloscope is looking for a signal or when timebase is set slow enough in which the scope requires longer time to “scan” in order to acquire the entire signal on display. Displays position of the present waveform window in internal memory. Marker shows horizontal trigger position. Turn the HORIZONTAL POSITION KNOB to adjust the position of the marker. Print Key – Indicates whether the PRINT KEY option is set to print picture or save picture. • 5.
Package Contents The digital storage oscilloscopes are shipped with the following contents: • 2530B/2532B Digital Storage Oscilloscope • User Manual • Easyscope Software Installation Disk • USB (Type A to B) communication cable • AC Power Cord • Two 10:1 passive oscilloscope probes Please locate each item from the original packaging and contact B&K Precision immediately if something is missing. Checking Functions Please follow the steps below when checking the oscilloscope’s functionality. 1.
Figure 5 - Scope Layout 2. Set the switch to 1X on the probe and connect the probe to channel 1 on the oscilloscope. To do this, align the slot in the probe connector with the key on the CH 1 BNC, push to connect, and twist to the right to lock the probe in place. Connect the probe tip and reference lead to the PROBE COMP connectors. Figure 6 - Probe Compensation 3. Press “AUTO” to show the 1 kHz frequency and about 3V peakpeak square wave in couple seconds.
Figure 7 - 3Vpp Square Wave 4. Press “CH1” two times to cancel the channel 1, Press“CH2” to change screen into channel 2, reset the channel 2 as step 2 and step 3. Probe Safety A guard around the probe body provides a finger barrier for protection from electric shock.
Connect the probe to the oscilloscope and connect the ground terminal to ground before you take any measurements. Note: ● To avoid electric shock when using the probe, keep fingers behind the guard on the probe body. ● To avoid electric shock while using the probe, do not touch metallic portions of the probe head while it is connected to a voltage source. Connect the probe to the oscilloscope and connect the ground terminal to ground before you take any measurements.
Note. When the attenuation switch is set to 1X, the probe limits the bandwidth of the oscilloscope to 10 MHz (according to Probe spec). To use the full bandwidth of the oscilloscope, be sure to set the switch to 10X. Probe Compensation As an alternative method to Probe Check, you can manually perform this adjustment to match your probe to the input channel. Figure 9 - Probe Compensation Setup 1. 2. 3. Set the Probe option attenuation in the channel menu to 10X.
Overcompensated 4. Compensated Correctly Undercompensated If necessary, adjust your probes compensation trimmer pot. Repeat as necessary.
Chapter 2 Functions and Operating Descriptions To use your oscilloscope effectively, you need to learn about the following oscilloscope functions: • Menu and control button • Connector • Auto Setup • Default Setup • Universal knob • Vertical System • Horizontal System • Trigger System • Acquiring signals System • Display System • Measuring waveforms System • Utility System • Storage System • Online Help function 23
Menu and Control Button Figure 10 - Control Buttons Channel buttons (CH1, CH2): Press a channel button (CH1 or CH2) to turn that channel ON or OFF and open the Channel menu for that channel. You can use the channel menu to set up a channel. When the channel is ON, the channel button is lit. MATH: Press to display the Math menu. You can use the MATH menu to use the oscilloscope’s Math functions. REF: Press to display the Ref Wave menu.
HORI MENU: Press to display the Horizontal menu. You can use the Horizontal menu to display the waveform and to zoom a segment of a waveform. TRIG MENU: Press to display the Trigger menu. You can use the Trigger menu to set the trigger type (Edge, Pulse, Video, Slope, Alternative) and trigger settings. SET TO 50%: Press to stabilize a waveform quickly. The oscilloscope can set the trigger level to be halfway between the minimum and maximum voltage level automatically.
UTILITY: Press to open the Utility menu. You can use the Utility menu to configure oscilloscope features, such as sound, language, counter, etc. You can also view system status and update software. DEFAULT SETUP: Press to reset the oscilloscope’s settings to the default factory configuration. HELP: Enter the online help system. AUTO: Automatically sets the oscilloscope controls to produce a usable display of the input signals. RUN/STOP: Continuously acquires waveforms or stops the acquisition.
EXT TRIG: Input connector for an external trigger source. Use the Trigger Menu to select the “Ext” or “Ext/5” trigger source. Probe Compensation: 1 kHz voltage probe compensation output and ground. Use to electrically match the probe to the oscilloscope input circuit. Auto Setup The 2530B/2532B Digital Storage Oscilloscopes have an Auto Setup function that identifies the waveform types and automatically adjusts controls to produce a usable display of the input signal.
Table 1 - Autoset Menu Option Description (Multi-cycle sine) Auto set the screen and display several cycles signal. (Single-cycle sine) Set the screen and auto display single cycle signal. Auto set and show the rising time. (Rising edge) Auto set and show the falling time. (Falling edge) (Undo Setup) Causes the oscilloscope to recall the previous setup.
Table 2 - Autoset Function Menu Items Function Setting Acquire Mode Adjusted to Sampling Display Format Display Type Y-T Set to Dots for a video signal, set to Vectors for an FFT spectrum; otherwise, unchanged Vertical Coupling Adjusted to DC or AC according to the input signal V/div Adjusted VOLTS/DIV adjustability Coarse Signal inverted Off Horizontal position Center TIME/DIV Adjusted Trigger type Edge Trigger source Auto detect the channel which has the input signal Trigger slope
Default Setup The oscilloscope is set up for normal operation when it is shipped from the factory. This is the default setup. To recall this setup, press the DEFAULT SETUP button. For the default options, buttons and controls when you press the DEFAULT SETUP button, refer to “Appendix A Default Setup”.
Universal Knob Figure 13 - Universal Knob You can use the Universal knob with many functions, such as adjusting the hold off time, moving cursors, setting the pulse width, setting the video line, adjusting the upper and lower frequency limit, adjust X and Y masks when using the pass/fail function, etc. You can also turn the “Universal” knob to adjust the storage position of setups, waveforms, pictures when saving/recalling, and to select menu options.
Vertical System The vertical control could be used for displaying waveform, rectify scale and position.
Channel Function Menu Table 3- Channel Function Menu Option Setting Introduction Coupling DC DC passes both AC and DC components of the input signal. AC AC blocks the DC component of the input signal and attenuates signals below 10 Hz. Volts/Div GND GND disconnects the input signal. Coarse Selects the resolution of the Volts/Div knob Fine Coarse defines a 1-2-5 sequence. Fine changes the resolution to small steps between the coarse settings.
Option Setting Instruction Invert on Turn on invert function. off Turn off invert function. Filter Press this button to enter the “Digital Filter menu”. Next Page Page 2/2 Press this button to return the first page menu. Table 4 - Channel Function Menu 2 Option Setting Introduction Filter On Turn on the digital filter. Off Turn off the digital filter. Type Setup as LPF (Low Pass Filter). Setup as HPF (High Pass Filter). Setup as BPF (Band Pass Filter).
• “GND” Coupling: Use GND coupling to display a zero-volt waveform. Internally, the channel input is connected to a zero-volt reference level. • Fine Resolution: The vertical scale readout displays the actual Volts/Div setting while in the fine resolution setting. Changing the setting to coarse does not change the vertical scale until the VOLTS/DIV control is adjusted. Note: ● The oscilloscope vertical response rolls off slowly above its bandwidth.
Take the CH1 for example; the tested signal is a sine wave signal with DC deflection: • Press“CH1”→“Coupling”→“AC”, Set to AC couple mode. This will block the DC component of the input signal. Figure 15 - AC Coupling • Press“CH1”→“Coupling”→“DC”, Set to DC couple mode. Both DC and AC components of the input signal will be captured.
Figure 16 - DC Coupling • Press“CH1”→“Coupling”→“GND”, Set to GROUND mode. This disconnects the input signal.
2. Volts/Div Settings Vertical scale adjust have Coarse and Fine modes, Vertical sensitivity range of 2 mV/div – 10 V/div. Take CH1 for example: • Press“CH1”→“Volts/Div”→“Coarse”. It is the default setting of Volts/Div, and it makes the vertical scaling in a 1-2-5-step sequence from 2 mV/div, 5 mV/div, 10 mV/div to 10 V/div. Figure 18 - Coarse Control • Press CH1”→ Volts/Div”→ Fine”. This setting changes the vertical control to small steps between the coarse settings.
Figure 19 - Fine Control 3. Setting Probe Attenuation In order to assort the attenuation coefficient, you need to respond in the channel operation Menu. If the attenuation coefficient is 10:1, the input coefficient should be set to 10X, so that the Volts/div information and measurement testing is correct.
Figure 20 - Setting Probe Attenuation 4.
5. Using the Digital Filter Press “CH1”→“Next Page page1/2”→ “Filter”, display the digital filter menu. Select “Filter Type”, then select “Upper Limit” or “Lower Limit” and turn the “Universal” knob to adjust them. • Press “CH1”→“Next Page page1/2”→ “Filter” →“Off”. Turn off the Digital Filter function. Figure 22 - Digital Filter Menu • Press “CH1”→ “Next Page page1/2”→ “Filter” → “On”. Turn on the Digital Filter function.
Figure 23 - Digital Filter Adjustment Screen Using Vertical Position Knob and Volt/div Knob • Vertical “POSITION” knob 1. Use the Vertical “POSITION” knobs to move the channel waveforms up or down on the screen. This button’s resolution varies based on the vertical scale. 2. When you adjust the vertical position of channel waveforms, the vertical position information will display on the bottom left of the screen. For example “Volts Pos=24.6mV”. 3.
• 1. “Volts/div” knob Use the “Volts/div” knobs to control how the oscilloscope amplifies or attenuates the source signal of channel waveforms. When you turn the “volts/div” knob, the oscilloscope increases or decreases the vertical size of the waveform on the screen with respect to the ground level; 2. When you press the “Volt/div” Knob, you can switch “Volt/div” option between “Coarse” and “Fine”. The vertical scale is set by the 1-2-5 step in the Coarse.
Table 6 - Math Function Menu Function Setting Introduction Operation +, -. *, /, FFT Math operations between signal source CH1 and CH2. CH1 Invert on off Invert the CH1 waveform. Turn off CH1 Invert function. CH2 Invert on off Invert the CH2 waveform. Turn off CH2 Invert function. Table 7 - Math Function Description Operation Setting Introduction + CH1+CH2 CH1 waveform adds CH2 waveform. - CH1-CH2 The channel 2 waveform is subtracted from the channel 1 waveform.
MATH Waveform Figure 24- CH1 added with CH2 FFT Spectrum Analyzer The FFT process mathematically converts a time-domain signal into its frequency components. You can use the Math FFT mode to view the following types of signals: • Analyze the harmonic wave in a power cable.
Table 8 - FFT Function Menu 1 FFT Option Setting Introduction Source CH1, CH2 Select this channel as the FFT source. Window Hanning Hamming Rectangular Blackman Select FFT window types. FFT ZOOM 1X 2X 5X 10X Changes the horizontal magnification of the FFT display. Next Page Page 1/2 Enter the second page of FFT menu. Table 9 - FFT Function Menu 2 FFT Option Setting Introduction Scale Vrms Set Vrms to be the Vertical Scale unit. dBVrms Set dBVrms to be the vertical Scale unit.
4. Turn the horizontal “POSITION” knob to position the part of the YT waveform that you want to analyze in the center eight divisions of the screen. 5. The oscilloscope calculates the FFT spectrum using the center 1024 points of the time-domain waveform. 6. Turn the “Volts/div” knob to ensure that the entire waveform remains on the screen. 7. Turn the “time/div” knob to provide the resolution you want in the FFT spectrum. 8. If possible, set the oscilloscope to display many signal cycles.
Displaying the FFT Spectrum Press the MATH button to display the Math Menu. Use the options to select the Source channel, Window algorithm, and FFT Zoom factor. You can display only one FFT spectrum at a time. You can select “Full screen” or “Split” in “Display” option to display FFT waveform on full screen or display channel waveform and its FFT waveform on half screen at a time.
Select FFT Window Windows reduce spectral leakage in the FFT spectrum. The FFT assumes that the YT waveform repeats forever. With an integral number of cycles, there are no discontinuities in the signal shape. A non-integral number of cycles in the YT waveform cause the signal start and end points to be at different amplitudes. The transitions between the start and end points cause discontinuities in the signal that introduce high-frequency transients.
frequency resolution. waveforms, to find higher order harmonics. Magnifying and Positioning and FFT Spectrum You can magnify and use cursors to take measurements on the FFT spectrum. The oscilloscope includes an “FFT Zoom” option to magnify horizontally, press this option button to select “1X”, “2X”, “5X” or “10X”. Moreover, you also can turn the “Universal” knob to magnify FFT waveform horizontally in a 1-2-5 step. To magnify vertically; you can turn the “Volts/div” knob.
1. Input a sine signal to channel 1, and press the “AUTO” button. 2. Press the “MATH” button to enter the “MATH” menu. 3. Press the “Operation” option button to select “FFT”. 4. Press the “Source” option button to select “CH1”. 5. Press CH1 button to display CH1 menu. 6. Turn the “time/div” knob to adjust sampling rate (at least double bigger than frequency of input signal). 7. If FFT display on full screen, press CH1 button again to remove channel waveform display. 8.
Figure 26 - Measure FFT Screen 2. Measure FFT Frequency 1. Press the CURSOR button. 2. Press the “Cursor Mode” button to select “Manual”. 3. Press the “Type” option button to select “Time”. 4. Press the “Source” option button to select “FFT”. 5. Press the “CurA” option button, turn the “Universal” button to move Cursor A to the highest position of the FFT waveform. 6. The value of CurA displaying on the top of the left screen is FFT highest Frequency.
Figure 27 - Measure FFT Frequency Screen NOTE: - The FFT of a waveform that has a DC component or offset can cause incorrect FFT waveform magnitude values. To minimize the DC component, choose AC Coupling on the source waveform. - To display FFT waveforms with a large dynamic range, use the dBVrms scale. The dBVrms scale displays component magnitudes using a log scale. - The Nyquist frequency is the highest frequency that any real-time digitizing oscilloscope can acquire without aliasing.
Using REF The reference control saves waveforms to a nonvolatile waveform memory. The reference function becomes available after a waveform has been saved. Table 11 - REF Function Menu Option Setting Introduction Source CH1,CH2, CH1 off CH2 off Choose the waveform display to store. REFA REFB Save REFA/REFB Choose the reference location to store or recall a waveform. Stores source waveform to the chosen reference location. on off Recall the reference waveform on the screen.
Operation step: 1. Press the “REF” menu button to display the “Reference waveform menu”. 2. Press the “Source” option button to select input signal channel. 3. Turn the vertical “POSITION” knob and “Volt/div” knob to adjust the vertical position and scale. 4. Press the third option button to select “REFA” or “REFB” as storage position. 5. Press the “Save” option button. 6. Press the bottom option button to select “REFA On” or “REFB On” to recall the reference waveform.
Note: - X-Y mode waveforms are not stored as reference waveforms. - You cannot adjust the horizontal position and scale of the reference waveform. Horizontal System Shown below, there is one button and two knobs in the HORIZONTAL area. Table 12 - Horizontal System Function Menu Option Delayed Setting On Off Description Turn on this function for main timebase waveform to display on the top half screen and window timebase waveform to display on the below half screen at the same time.
Changing the horizontal scale causes the waveform to expand or contract around the screen center. • Horizontal “POSITION” knob 1. Adjust the horizontal position of all channels and math waveforms (the position of the trigger relative to the center of the screen). The resolution of this control varies with the time base setting. 2. When you press the horizontal “POSITION” Knob, you can set the horizontal position to zero. • “time/div” knob 1.
• Display scan mode: When the TIME/DIV control is set to100 ms/div or slower and the trigger mode is set to Auto, the oscilloscope enters the scan acquisition mode. In this mode, the waveform display updates from left to right. There is no trigger or horizontal position control of waveforms during scan mode. Window Zone Use the Window Zone option to define a segment of a waveform to see more detail. This function behaves like zooming into a portion of the captured waveform.
Figure 30 - Horizontal Delay Menu 4. Turn the “Horizontal Position” knob (adjust window’s position) to select the window that you need and expanded window waveform display will show on the below half of the screen at the same time. Trigger System The trigger determines when the oscilloscope starts to acquire data and display a waveform. When a trigger is set up properly, the oscilloscope converts unstable displays or blank screens into meaningful waveforms.
• “TRIG MENU” Button: Press the “TRIG MENU” Button to display the “Trigger Menu”. • “LEVEL” Knob: The LEVEL knob is to set the corresponding signal voltage of trigger point in order to sample. Press the “LEVEL” knob to set trigger level to zero. • “SET TO 50%” Button: Use the “SET TO 50%” button to stabilize a waveform quickly. The oscilloscope can set the Trigger Level to be about halfway between the minimum and maximum voltage levels automatically.
The feature is very useful because you can see the events that led up the trigger point. Everything to the right of the trigger point is the post-trigger information. The amount of delay range (pretrigger and post-trigger information) available is dependent on the sweep speed selected. Signal Source You can use the Trigger Source options to select the signal that the oscilloscope uses as a trigger.
Table 13 - Edge Trigger Function Menu Option Setting Explain Type Edge With Edge highlighted, the rising or falling edge of the input signal is used for the trigger. Source CH1 CH2 Triggers on a channel whether or not the waveform is displayed. EXT Does not display the trigger signal; the Ext option uses the signal connected to the EXT TRIG frontpanel BNC and allows a trigger level range of 1.2 V to +1.2 V.
Table 14 - Trigger Setup Function Menu Option Setting Explain Coupling DC Passes all components of the signal Blocks DC components, attenuates signals below 50 Hz. Attenuates the high-frequency components above 150 kHz. Blocks the DC component attenuates the lowfrequency components below 7 kHz. Using the “universal” knob to adjust holdoff time AC HF Reject LF Reject Holdoff (sec), the holdoff value is displayed. Holdoff Reset holdoff time to 100 ns.
Operating Instructions: 1. Set up Type 1) Press the “TRIG MENU” button to display “Trigger” menu. 2) 2. Press the “Type” option button to select “Edge”. Set up Source According to input signal, press the “Source” option button to select “CH1”, “CH2”, “EXT”, “EXT/5”or “AC Line”. 3. Set up Slope Press the “Slope” option button to select “ ” or “ 4. ”,“ ”. Set up Trigger mode Press the “Trigger mode” option button to select “Auto”, “Normal”, “Single”.
Single: The oscilloscope acquire a waveform when the trigger condition is satisfied and then stops. 5. Set up Trigger coupling • Press the “Set up” button to enter the “Trigger Setup Menu”. • Press the “Coupling” option button to select “DC”, “AC”, “HF Reject” or “LF Reject”. Pulse Trigger Use Pulse Width triggering to trigger on aberrant pulses.
When (Positive pulse width less than pulse width setting) (Positive pulse width larger than pulse width setting) Select how to compare the trigger pulse relative to the value selected in the Set Pulse Width option. (Positive pulse width equal to pulse width setting) (Negative pulse width less than pulse width setting) (Negative pulse width larger than pulse width setting) Set Width (Negative pulse width equal to pulse width setting) 20.0 ns~10.
Table 16 - Pulse Trigger Function Menu 2 Option Type Mode Setting Pulse Explain Select the pulse to trigger the pulse match the trigger condition. Auto Normal single Select the type of triggering; Normal mode is best for most Pulse Width trigger applications. Set up Enter the “Trigger setup menu”. Next Page Page 2/2 Press this button to return the first page. Figure 33 - Pulse Trigger Menu 2 Operating Instructions: 1. Set up Type 1) Press the “TRIG MENU” button to display “Trigger menu”.
Press the “When” option button to select “ ”, “ 3. ”, “ ”, “ ”or “ ”, “ ”. Set up pulse width Turn the “Universal” knob to set up width. Video Trigger Trigger on fields or lines of standard video signals. Table 17 - Functional Menu of Video Trigger 1 Option Type Setting Video Source CH1 CH2 Instruction When you select the video type, put the couple set to the AC, then you could trigger the NTSC, PAL and SECAM video signal. Select the input source to be the trigger signal.
Figure 34 - Video Trigger Screen Table 18 - Functional Menu of Video Trigger 2 Option Type Setting Video Standard NTSC Pal/Secam Auto Mode Instruction When you select the video type, put the couple set to the AC, then you could trigger the NTSC,PAL and SECAM video signal. Select the video standard for sync and line number count. Use this mode to let the acquisition free-run in the absence of a valid trigger.
Next Page Page 2/2 Return the first page of “Video Trigger menu”. Operating Instructions: Set up Type 1. Press the “TRIG MENU” button to display “Trigger” menu. 2. Press the “Type” option button to select “Video”. Set up Polarity 1. Press the “Polarity” option button to select “ ” or “ Set up Synchronization 1. Press the “Sync” option button to select “All Lines”, “Line Num”, “Odd Field”, and “Even Field”. 70 ”.
2. If you select “Line Num”, you can turn the “Universal” knob to set the appointed line number. Set up Standard 1. Press the “next Page Page2/2” option button. 2. Press the “Standard” option button to select “PAL/SECAM” or “NTSC”. Slope Trigger Trigger on positive slope or negative slope according to setup time of the oscilloscope.
Time Turn the “Universal” knob to set slope time. Time setup range is 20ns-10s. Enter the second page of slope trigger. < Set Time> Next Page Page 1/2 Figure 35 - Slope Trigger Menu Table 20 - Slope Trigger Function Menu 2 Option Type Setting Slope Instruction Trigger on positive slope of negative slope according to setup time of the oscilloscope.
Vertical Select the trigger level that can be adjusted by “LEVEL” knob. You can adjust “LEVEL A”, “LEVEL B” or adjust them at the same time. Auto Mode Normal Single Set up Next Page Page 2/2 Use this mode to let the acquisition free-run in the absence of a valid trigger; This mode allows an untriggered, scanning waveform at 100 ms/div or slower time base settings.
Figure 36 - Slope Trigger Menu 2 Operating Instructions: Follow next steps if you select “Slope trigger”: 1. Input a signal to CH1 or CH2. 2. Press the “AUTO” button. 3. Press the “TRIG MENU” button to enter “Trigger menu”. 4. Press the “Type” option button to select “Slope”. 5. Press the “Source” option button to select “CH1” or “CH2”. 6. Press the “When” option button to select “ ”, “ ”, “ ”.
7. Press the “Time” button and turn the “Universal” knob to adjust slope time. 8. Press the “Next Page - Page 1/2” option button to enter the second page of the “Slope trigger menu”. 9. Press the “Vertical” option button to select a trigger level that can be adjusted. 10. Turn the “LEVEL” knob. Alternative Trigger The trigger signal comes from two vertical channels when you use alternative trigger. In this mode, you can observe two irrelative signals at the same time.
Table 21 - Set Trigger Mode to Edge Trigger Function Menu 1 Option Setting Instruction Type Alternative The trigger signal comes from two vertical channels when you use alternative trigger. In this mode, you can observe two irrelative signals at the same time. Source CH1 CH2 Set trigger type information for CH1 signal. Set trigger type information for CH2 signal. Mode Edge Set trigger type of the vertical channel signal to Edge. Slope Triggering on rising edge. Triggering on falling edge.
Select how to compare the trigger pulse relative to the value selected in the Set Pulse Width option. When Next Page Enter the second page of Alternative trigger menu. Page 1/2 Table 23 - Set Trigger Mode to Pulse Trigger Function Menu 2 Option Setting Explain Set Width 20.0 ns~10.0 s Selecting this option can turn the universal to set up the pulse width. Set up Next Page Enter the “Trigger Setup Menu” (see table 2-14). Press this button to return to the first page.
(Normal) (Inverted) Polarity Next Page Page 1/2 Normal triggers on the negative edge of the sync pulse. Inverted triggers on the positive edge of the sync pulse. Enter the second page of Alternative trigger menu. Table 25 - Set Trigger Mode to Video Trigger Function Menu 2 Option Setting Instruction Sync All lines Line Num Odd field Even Field Select appropriate video sync. Standard NTSC Pal/Secam Select the video standard for sync and line number count.
When Next Page Select slope trigger condition. Page 1/2 Enter the second page of the alternative trigger. Table 27 - Set Trigger Mode to Slope Trigger Function Menu 2 Option Setting Time (Set time) Vertical Set up Next Page Page 2/2 Instruction Turn the “Universal” knob to set the slope time. Time setup range is 20ns-10s. Select the trigger level that can be adjusted by “LEVEL” knob. You can adjust “LEVEL A”, “LEVEL B” or adjust them at the same time. Selections depend on slope trigger condition.
Operation Instructions: To observe two irrelative channel signals, follow these steps : 1. Input two irrelative signals to channel 1 and channel 2. 2. Press the AUTO button. 3. Press the TRIG MENU button to enter “trigger menu”. 4. Press the “Type” option button to select “Alternative”. 5. Press the “Channels” option button to select “CH1-CH2” 6. Press the “Source” option button to select “CH1”. 7. Press the CH1 button and turn the “time/div” knob to optimize waveform display. 8.
Coupling Use “Coupling” to make sure the signal passes through the trigger circuit. It is useful for obtaining a steady wave form. If you use trigger coupling, you should press the “TRIGGER” button and then select “Edge”, “Pulse”, “Video”, or “Slope” trigger. Then select the “coupling” option in the “Set Up menu”. Position The horizontal position control establishes the time between the trigger position and the screen center.
The TRIGGER LEVEL knob controls where on the edge the trigger point occurs. Figure 38 - Rise and Fall Edge Note: ● Press the SINGLE button when you want the oscilloscope to acquire a single waveform. ● Trigger coupling affects only the signal passed to the trigger system. It does not affect the bandwidth or coupling of the signal displayed on the screen. ● Normal Polarity Sync triggers always occur on negative-going horizontal sync pulses.
will not trigger during the holdoff time. For a pulse train, you can adjust the holdoff time so the oscilloscope triggers only on the first pulse in the train. Trigger position Trigger level Holdoff time Figure 39 - Trigger Holdoff If you want to change holdoff time, please follow the steps below: 1. Press the “TRIG MENU” button to show the “TRIG Menu”. 2. Press the “Type” option button to select trigger type. 3. Press the “Set Up” option button to enter the “Trigger setup menu”. 4.
Acquiring Signals System Shown below is the “ACQUIRE” button for entering the menu for “Acquiring Signals”. Table 28- Acquiring Signals Function Menu Option Setting Introduction Acquisition Sampling Use for sampling and accurately display most of the waveform. Peak Detect Detect the noise and decrease the possibility of aliasing. Average Use to reduce random or uncorrelated noise in the signal display. Sinx/x Mode Sa Rate Averages (4, 16, 32, 64, Select number of averages.
• Sampling: In this acquisition mode, the oscilloscope samples the signal in evenly spaced intervals to construct the waveform. This mode accurately represents signals most of the time. Advantage: You can use this mode to reduce random noise. Disadvantage: This mode does not acquire rapid variations in the signal that may occur between samples. This can result in aliasing, which may cause narrow pulses to be missed. In these cases, you should use the Peak Detect mode to acquire data.
Advantage: In this way, the oscilloscope can acquire and display narrow pulses, which may have otherwise been missed in Sample mode. Disadvantage: Noise will appear to be higher in this mode. Figure 41 - Peak Detect • Average: The oscilloscope acquires several waveforms, averages them, and displays the resulting waveform. Advantage: You can use this mode to reduce random noise.
Figure 42 - Acquisition Averaging Screen • Equivalent Time Sampling: The equivalent time sampling mode can achieve up to 10 GSa/s. • Real Time Sampling: The oscilloscope’s maximum real-time sampling rate is 500 MSa/s. • “RUN/STOP” Button: Press the RUN/STOP button when you want the oscilloscope to acquire waveforms continuously. Press the button again to stop the acquisition. • “SINGLE” Button: Press the SINGLE button to acquire a single waveform.
oscilloscope detects a trigger it completes the acquisition and stops. When you push the RUN/STOP or SINGLE buttons to start an acquisition, the oscilloscope goes through the following steps: 1. Acquire enough data to fill the portion of the waveform record to the left of the trigger point. This is also called the pre-trigger. 2. Continue to acquire data while waiting for the trigger condition to occur. • 3. Detect the trigger condition. 4. Continue to acquire data until the waveform record is full.
waveform with a frequency lower than the actual input waveform, or triggers and displays an unstable waveform. Actual high-frequency waveform Apparent low-frequency waveform due to aliasing Sampled points Figure 43 - Time Domain Aliasing Operating Instructions: Set up Sampling Format You can press the “Acquisition” option button or turn the “Universal” knob to select “Sampling” mode, “Peak Detect” mode or “Average” mode.
Figure 44 - "On" for Sine Interpolation Figure 45 - "Off" for Linear Interpolation 90
Set up Sampling mode Press the “Mode” option button to select “Real Time” or “Equ Time”. Set up Sampling rate Adjust the sampling rate by pressing the “Sa Rate” option button and turning the Time/div front panel knob. The sampling rate is shown at the corresponding timebase scale. Display System The display function could be expressed by the “DISPLAY” button.
Table 29- Display System Function Menu 1 Option Type Setting Vectors Dots Persist Off 1 sec 2 sec 5 sec Infinite Introduction Vectors: Fills the space between adjacent sample points in the display. Dots: There is no link between adjacent sample points. Sets the length of time each displayed sample point remains displayed. Intensity Set waveforms’ intensity. Set grid brightness. Brightness Next Page Page 1/3 Press this button to enter second page.
Figure 46 - Display Menu Screen Table 30 - Display System Function Menu 2 Option Format Setting YT Introduction YT format displays the vertical voltage in relation to time (horizontal scale). XY Screen XY format displays a dot each time a sample is acquired on channel 1 and channel 2. Set to normal mode. Set to invert color display mode. Display grids and axes on the screen. Turn off the grids. Turn off the grids and axes. Normal Inverted Grid Menu 2sec Set menu display time on screen.
Display Next Page 5sec 10sec 20sec Infinite Page 2/3 Press this button to enter the second page of “Display menu”. Figure 47 - Display Menu 2 Table 31 - Display System Function Menu 3 Option Skin Next Page Setting Classical Modern Tradition Succinct Page 3/3 Introduction Set up screen style. Press this button to return the first page.
Operate Introduction: Setup waveform display type 1. Press the “DISPLAY” button to enter the “Display” menu. 2. Press the “Type” option button to select “Vectors” or “Dots”. Set up Persist Press the “Persist” option button to select “Off”, “1 Sec”, “2 Sec”, “5 Sec” or “Infinite”. You can use this option to observe some special waveforms.
Setup Intensity Press the “Intensity” option button and turn the “Universal” knob to adjust waveforms’ intensity. Setup Brightness Press the “Brightness” option button and turn the “Universal” knob to adjust grid brightness. Setup Display Format 1. Press the “Next Page” option button to enter second display menu. 2. Press the “Format” option button to select “YT” or “XY” Setup Grid Press the “Grid” option button to select “ ”or“ ”, “ ”to set the screen whether to display grid or not.
Set Skin Press the “skin” option button or turn the “Universal” knob to select “Classical”, “Modern”, “Traditional”, or “Succinct”. X-Y Format Use the XY format to analyze phase differences, such as those represented by Lissajous patterns. The format plots the voltage on channel 1 against the voltage on channel 2, where channel 1 is the horizontal axis and channel 2 is the vertical axis. The oscilloscope uses the untriggered Sample acquisition mode and displays data as dots.
the horizontal scale and position. ● Turn the “time/div” knob to adjust the sampling rate ● The following functions are forbidden at XY display form: ● Benchmark waveform and wave mathematics ● Cursor ● Auto (resets display format to YT) ● Trigger Control ● Horizontal Position Knob ● Vector Display Type ● Scan Display Note: When the display type is set to Vector, the oscilloscope connects the sample points by using digital interpolation.
Measure System The oscilloscope displays the voltage in relation to time and test the waveform displayed. There are scale, cursor, and auto measure modes. Scale Measurement This method allows you to make a quick visual estimate. For example, you might look at waveform amplitude and determine that it is a little more than 100 mV. You can take simple measurements by counting the major and minor graticule divisions involved and multiplying by the scale factor.
Manual Mode Table 32 - Manual Cursor Function Menu Option Cursor Mode Type Setting Manual Source CH1 CH2 MATH/FFT REFA REFB Cur A Cur B Voltage Time Instruction In this menu, set the manual cursor measure. Use cursor to measure voltage parameters. Use cursor to measure time parameters. Select input signal channel. Select this option, turn the “Universal” knob to adjust cursor A. Select this option, turn the “Universal” knob to adjust cursor B.
1. 2. 3. 4. 5. 6. 7. Press CURSOR button to enter the cursor function menu. Press the “Cursor Mode” option button to select “Manual”. Press the “Type” option button to select “Voltage” or “Time” Press the “Source” option button to select “CH1”, and “CH2”, “MATH”, “FFT”, “REFA”, “REFB” according to input signal channel. Select “Cur A” and turn the “Universal” knob to adjust Cursor A. Select “Cur B” and turn the “Universal” knob to adjust Cursor B.
Track Mode Table 33- Track Mode Function Menu Option Cursor Mode Cursor A Cursor B Cur A Cur B Setting Track CH1 CH2 NONE CH1 CH2 NONE Instruction In this mode, set track cursor measure. Set the input signal channel that the Cursor A will measure. Set the input signal channel that the Cursor B will measure. Select this option, turn the “Universal” knob to adjust horizontal coordinate of Cursor A. Select this option, turn the “Universal” knob to adjust horizontal coordinate of Cursor B.
4. Press the “Cursor B” option button to select the input signal channel. 5. Select “Cur A”, turn the “Universal” knob to move Cursor A horizontally. 6. Select “Cur B”, turn the “Universal” knob to move Cursor B horizontally. 7.
Figure 50 - Cursor Menu Auto Mode Table 34 - Auto Mode Function Menu Option Cursor Mode Setting Auto Instruction Set to auto cursor measure mode. This mode will take effect with automatic measurements. The instruments will display cursors while measuring parameters automatically. These cursors demonstrate the physical meanings of these measurements. To do auto cursor measurements, follow these steps: 1. Press the CURSOR button to enter “Cursor measure menu”. 2.
Press the “MEASURE” button to enter “Auto cursor measure mode menu” to select the parameter that you want to measure. Figure 51 - Auto Mode Auto Measurement “MEASURE” button as shown below enters the “Automatic Measure Function Menu”.
When you take automatic measurements, the oscilloscope does all the calculation for you. The measurements use all the recorded points in the memory, which are more accurate than measurements made using the graticule lines or cursor measurements because these measurements are confined to be made by only using points on the display and not all the data points recorded by the oscilloscope. Press the ‘MEASURE’ button for Automatic Test.
Figure 52 - Auto Measure Menu 1 Table 36 - Auto Measure Function 2 - Voltage Measure Menu Option Source Setting CH1, CH2 Type Vpp, Vmax, Vmin, Vamp, Vtop, Vbase, Vavg, Mean, , Vrms, Cycle Vrms, FOVShoot, FPREShoot, ROVShoot, RPREShoot, Instruction Select input signal source for Voltage measure. Press the “Type” button or turn the “Universal” knob to select Voltage measure parameter. Display the corresponding icon and measure value of your selected Voltage measure parameter.
Table 37 - Auto Measure Function 3 - Time Measure Menu Option Source Setting CH1, CH2, MATH, REFA, REFB Type Freq, Period, +Width, Width, Rise Time, Fall Time, BWidth, +Duty, -Duty Return Instruction Select input signal source for Time measure. Press the “Type” button or turn the “Universal” knob to select Time measure parameter. Display the corresponding icon and measure value of your selected time measure parameter. Return to the first page of auto measurement menu.
Return Return to the first page of auto measurement menu. Table 39 - All Measurement Function Menu Option Source Voltage Setting CH1 CH2 On Off Time On Off Delay On Off Return Instruction Select input signal channel. Turn on the all measurement function to measure voltage parameters. Turn of the all measurement function to measure voltage parameters. Turn on the all measurement function to measure Time parameters. Turn of the all measurement function to measure Time parameters.
Vtop Vbase Measures the lowest voltage over the entire waveform. Crms The arithmetic mean over the first cycle in the waveform. The arithmetic mean over the entire waveform. The true Root Mean Square voltage over the first cycle in the waveform. Vrms The true Root Mean Square voltage over the entire waveform. Vavg Mean ROVShoot Defined as (Vmax-Vhig)/Vamp after the waveform rising. FPREshoot FREQ Defined as (Vmin-Vlow)/Vamp after the waveform falling.
- Wid -Width Measures the time between the first falling edge and the next rising edge at the waveform 50% level. + Duty Measures the first cycle waveform. Positive Duty Cycle is the ratio between positive pulse width and period. -Duty Measures the first cycle waveform. Negative Duty Cycle is the ratio between negative pulse width and period. Phase The amount one waveform leads or lags another in time. Expressed in degrees, where 360 degrees comprise one waveform cycle.
2. Press the top first option button to enter the “second measurement menu”. 3. Select measure type. If you press the “Voltage” option button, “Voltage measurement” menu will display on the screen. 4. Press the “Source” option button to select “CH1”, “CH2” according to input signal channel. 5. Press the “Type” option button to select the parameter type that you want to measure. The corresponding icon and value will display below the measure parameter. Figure 53 - Measure Voltage Parameters 6.
You can display the other parameters and its’ value on the corresponding position in the same way. The screen can display up to five parameters at one time. If you want to measure time parameters using all measure function, please follow these steps: 1. Press the “MEASURE” button to enter the “Auto Measure menu”. 2. Press the top option button to enter the second page of “Auto Measure menu”. 3. Press “All Mea” option button to enter the “All Measure menu”. 4.
Storage System Shown below, the “SAVE/RECALL” button enters the “Storage System Function Menu”. The scope can save 2 groups’ reference waveforms, 20 groups’ setups, and 10 waveforms to the oscilloscope’s internal memory. There is a USB Host interface in the front panel of the oscilloscope where you can save setup data, waveform data, waveform interface image, CSV file to a USB flash drive. Setup data and waveform data can be recalled to the oscilloscope.
Select folder/files Create new Delete present Figure 55 - Save All Menu Screen 1 Select folder/files Create new files in present directories Delete Recall stored files or present Figure 56 - Save All Menu Screen 2 115
Modify the file Return to Figure 57 - Save All Menu Screen 3 Recalling Files The Load button is used to recall your setup files. Once you’ve navigated to the desired file and it’s highlighted in the main screen area, press the Load option button and the setup is recalled from the USB flash drive. Note: The Load button option is disabled (grayed-out) when Pictures or .csv file types are selected as Type. Both Directory and Files have Rename and Return option buttons on Page2/2.
Figure 58 - Save All Rename Screen Creating Folders and Files Create new folders and files by pressing the New Folder or New File option button.
• The New File menu choices and behavior is the same as the New Folder menu. It just has a different heading. The InputChar option button adds the selected character to the cursor position in Name field. • Move the cursor position in the name field using the “→” and “←” option buttons. • Turn the “Universal” knob to move through character selections.
Save/Recall Setup • Save Setups to Device: The complete setup is stored in nonvolatile memory. When you recall the setup, the oscilloscope will be in the mode from which the setup was saved. The oscilloscope saves the current setup if you wait three seconds after the last change before you power off the oscilloscope. The oscilloscope recalls this setup the next time you apply power.
To save setups to the oscilloscope’s internal memory, follow the steps below: For example: Save setup that set waveform display type to “Dots” to internal memory. 1. Press the “SAVE/RECALL” button to enter the “SAVE/RECALL” menu. 2. Press the “Type” option button to select “setups”. 3. Press the “Save to” option button to select “Device”. 4. Press the “Setup” option button to select “No.1”. 5. Press the “DISPLAY” button to enter the “Display” menu. 6.
5. • Press the “Recall” option button. Save Setup to USB Flash Drive Table 42 - Save Setup to USB Flash Drive Function Menu Option Setting Introduction Type Setups Menu for the Storage/Recall settings. Save to File Save setup data to USB flash drive. Save Go to the Save/Recall interface Figure 61 - Save Setup Screen Save Setup to USB Flash drive: For example: Save setup that set waveform display type to “Dots” to USB flash drive. 1. Press the “SAVE/RECALL” button to select “Setups”.
2. Insert USB flash drive to USB host port of the oscilloscope and wait until the oscilloscope has initialized USB flash drive (about five second). 3. Press the “Save to” option button to select “file”. 4. Press the “Save” option button to go into the Save/Recall interface. 5. Press the “New folder” button to create a new folder 6. Press the “Del folder” option button to delete a folder 7. Press the “Modify” option button to modify a folder. 8.
five seconds). 4. Press the “Save to” option button to select “File”. 5. Press the “Save” option button then you’ll go into the Save/Recall interface. 6. Choose the file you want then press the “Load” option button (about five seconds, there is a prompting message that shows “Read data success”), now setup data have been recalled from USB flash drive. • Recall Factory You can use this option to recall factory settings.
Figure 62 - Set Factory Default Screen Save/Recall Waveform Save Waveforms to Device Table 44 - Save Waveform to Device Function Menu Option Setup Introduction Type waveforms Menu for the Storage/Recall waveforms in the oscilloscope. Save to Device Save waveforms to the oscilloscope’s internal memorizer. waveform No.1 to No.10 Press the “waveform” option button or turn the “Universal” knob to select storage position. Accomplish the storage.
Figure 63 - Save Waveform Menu Screen To save waveforms in internal memory, do the following: 1. Input a sine signal to channel 1 and press the “Auto” button. 2. Press the “SAVE/RECALL” button to enter “SAVE/RECALL” display menu. 3. Press the “Type” option button to select “waveforms”. 4. Press the “Save to” option button to select “Device”. 5. Press the “waveform” option button or turn the “Universal” knob to select “No.1”. 6.
To recall waveforms, do the following: 1. Press the “SAVE/RECALL” button to enter “SAVE/RECALL” display menu. 2. Press the “Type” option button to select “waveforms”. 3. Press the “Save to” option button to select “Device”. 4. Press the “waveform” option button or turn the “Universal” knob to select “No.1”. 5. Press the “Recall” option button.
Figure 64 - Save Waveforms Screen Save waveforms to USB flash drive, follow next steps: 1. Input a sine signal to channel 1, press the “AUTO” button. 2. Press the “SAVE/RECALL” button to enter the “SAVE/RECALL” display menu. 3. Press the “Type” option button to select “Waveforms”. 4. Insert USB flash drive to USB host port of the oscilloscope and wait until the oscilloscope has initialized USB flash drive (about five seconds). 5. Press the “Save to” option button to select “File”. 6.
Recall waveforms form USB flash drive, follow next steps: 1. Press the “SAVE/RECALL” button. 2. Press the “Type” button to select “Waveforms”. 3. Insert USB flash drive to USB host port of the oscilloscope and wait until the oscilloscope has initialized USB flash drive (about ten seconds). 4. Press the “Save to” option button to select “File”. 5. Press the “Save” option button then go into the Save/Recall interface. 6.
Save Picture Save When the USB flash drive insert to the USB Host interface (now the USB flash drive open status icon displays on the top of the screen), select “Save picture” and press the “Save” knob to go into the Save/Recall interface. Go to the Save/Recall interface. Figure 65 - Save Picture Screen To save waveform image to USB flash drive, do the following: 1. Select the screen image that you want. 2. Press the “SAVE/RECALL” button to enter “SAVE/RECALL” menu. 3.
4. Insert USB flash drive to USB host port of the oscilloscope and wait until the oscilloscope has initialized USB flash drive (about five seconds). 5. Press the “Print Key” option button to select “Save Picture”. 6. Press the “Save” option button then go into the Save/Recall interface”. 7. Press the “Save” button then you’ll go into the Save/Recall interface 8.
Figure 66 - Save to CSV Screen To save CSV file to USB flash drive, do the following: 1. Press the “SAVE/RECALL” button to enter “SAVE/RECALL” menu. 2. Press the “Type” option button to select “CSV”. 3. Insert USB flash drive to USB host port of the oscilloscope and wait that the oscilloscope has initialized USB flash drive (about five seconds). 4. Press the “Data Depth” option button to select “Displayed” or “Maximum”. 5. Press the “Para Save” option button to select “On” or “Off”. 6.
7. Create a file name then press the “Confirm” button (About five seconds, there is a prompting message showing “Save data success” displaying on the screen), now CSV file has been saved to USB flash drive. Note: The maximum number of data points of a waveform that can be saved as a CSV file into USB drive is ~32768 pts (depending on the timebase setting) when data depth is set to maximum.
Utility System “UTILITY” system button is located as shown below: Table 48 - Utility System Function Menu 1 Option Setting Introduction System Status Displays summaries of the oscilloscope settings. Sound Open the key-press voice. Close the key-press voice. Counter On Off Turn on Frequency Counter Turn off Frequency Counter.
Next Page Page 1/4 Press this button to enter second page. Figure 67 - Utility Menu Screen 1 Table 49 - Utility System Function Menu 2 Option Setting Do self cal Do Self Test Auto self emendation. Screen Test Keyboard Test LED Test Print Setup Back USB Introduction Run the screen detect program Run the keyboard detect program Run the LED test detect program. Not available. Printer Not available. Computer The oscilloscope connects to the computer using USB cable.
Next Page Page 2/4 Press this button to enter third page. Figure 68 - Utility Menu Screen 2 Table 50 - Utility System Function Menu 3 Option Setting Introduction Page 3/4 You can update firmware of the oscilloscope use USB flash Driver (~ two minutes). Pres this button to enter the “Pass/Fail menu”. Press this button to enter the waveform record menu. Press this button to enter the “IO Setting menu” Press this button to enter first page.
Table 51 - IO Setting Function Menu Option Setting Introduction Baud 300 2400 4800 9600 19200 38400 Set up band rate. Note: When interfacing with the EasyScope software, it is recommended that users use the rear panel USB interface for communication instead of RS232 because transmission speed is noticeably slower when waveforms are being transferred from scope to PC via RS232 interface port.
Figure 69 - System Status Info Screen Table 53 - System Status Information Option Introduction Startup Times List the boot-strap times. Software version List the software version. Hardware Version List the hardware version. Product type List the product type. Serial No. List the product serial number. Language The oscilloscopes have twelve languages available and selectable for the menu items. Press the “UTILITY” button, then select “Language”.
Figure 70 - Language Selection Screen Self Calibration Self Calibration procedure can optimize the signal path at the most measurement precision. You can run this procedure at any time. If the operating temperature changes by more than 5° C or the units run more than thirty minutes, you should do the self calibration. When you run the self Calibration, you should disconnect all the probes and leads, and make sure the scope is not in Single-Shot mode.
Figure 71 - Calibration Screen Self Test Press “UTILITY” and select “Do Self Test” Table 54 - Self Test Menu Option Introduction Screen Test Run Screen Test Program. Keyboard Test LED Test Run Keyboard Test Program. Run LED Test Program. Screen Test Select “Screen Test” to enter the screen test interface. The message “Press ‘SINGLE’ Key to continue, Press ‘RUN/STOP’ Key to exit” is displayed. Press “Single” button for test, “Run/Stop” to exit.
Figure 72- Screen Test Start Screen Keyboard Test Select “keyboard Test” to enter the key test interface, the on-screen shapes represent the front panel keys. The shapes with two arrows beside them represent the front panel knobs. The squares represent the knob presses for scale knobs. Test all keys and knobs to verify that all the backlit buttons illuminate correctly. Note : • When you operate, the screen would display the white (Color LCD) and black (single LCD) repose.
• At the bottom of the screen display “Press‘ RUN/STOP’ Key Three Times to exit” information prompt to show that press “RUN/STOP” three times to end test. Figure 73 - Key Test Screen LED Test Select “LED Test” to enter the lighten interface, the on-screen lathy rectangle shapes represent the front panel keys; the lathy rectangle shapes represent the front panel knobs. The squares represent the knob presses for scale knobs.
Figure 74 - LED Test Screen Updating the System Software • Using USB flash drive to update firmware The software of the oscilloscope can be updated directly via USB Flash drive. This process takes about two minutes. Follow next steps: 1. Insert USB Flash Drive with firmware procedure to USB Host interface on the front panel of the oscilloscope. 2. Press the “UTILITY” button to enter the “Utility menu”. 3. Press “Next Page” option button to enter the third page of “Utility menu”. 4.
5. Press the “SINGLE” button to start updating the software according to prompt on the screen. When completed, turn off the oscilloscope and turn on again. The software will then be updated. The oscilloscope needs to execute “Do Self Cal” after update. Note: Don’t turn off the power while oscilloscope is updating. Otherwise, firmware will be corrupted and unit may not be able to boot up.
Next Page Page 1/2 of the waveform pass/fail. Press this button to enter second page of Pass/Fail menu. Figure 75 - Pass/Fail Screen 1 Table 56 - Pass/Fail Function Menu 2 Option Output Setting Pass Fail Stop On Output On Off Mask Setting Return Next Page Page 2/2 Instruction Output when pass condition detected. Output when fail condition detected. Stop test when output occur. Continue test when output occur. Press this button to enter the “Mask Setting menu”. Return to the Pass/Fail main menu.
Figure 76 - Pass/Fail Screen 2 Table 57 - Mask Setting Function Menu 1 Option X Mask Setting xdiv Y Mask ydiv Create Mask Location Next Page Instruction Turn the “Universal” knob to set the range of horizontal clearance to the waveform. <0.04div4.00div> Turn the “Universal” knob to set the range of vertical clearance to the waveform. <0.04div-4.00div> Create a test mask according to the above clearance. Internal External Page 1/2 Select position to store created mask.
Figure 77 - Mask Menu Screen 1 Table 58 - Mask Setting Function Menu 2 Option Save Setting Instruction Store created mask setting. Load Recall stored mask setting. Return Return to the main menu of mask setting. Return to the first page of the “Mask Setting menu”.
Figure 78 - Mask Menu Screen 2 RUN Pass/Fail test, please follow next page: 1. Press UTILITY button to enter the “Utility menu”. 2. Press the “Next Page Page1/4” option button. 1. Press the “Next Page Page2/4” option button to enter the third page of “Utility menu”. 2. Press the “Pass/Fail” option button to enter the “Pass/Fail” function menu. 3. Press the “Enable Test” option button to select “On”. 4. Press the “Source” option button to select input signal channel. 5.
6. Press the “Mask Setting” option button to enter the first page of “Mask menu”. 7. Press the “X Mask” button; turn the “Universal” knob to adjust the horizontal clearance. 8. Press the “Y Mask” button; turn the “Universal” knob to adjust the vertical clearance. 9. Press the “Create Mask” button to create mask and you also can enter the next page of “Mask menu” to recall the stored mask. 10.
Waveform Recorder Press the Record option to record the input waveform from CH1 and CH2 with a maximum record length of 2500 frames. The time between frames is adjustable.
Figure 80 - Record Menu Screen To record waveforms, follow these steps: 1. Press the UTILITY button to enter “Utility menu”. 2. Press the “Next Page” option button to enter the third page of “Utility menu”. 3. Press the “Record” button to enter “Waveform Record Menu”. 4. Press the “Mode” option button to select “Record”. 5. Press the “Source” option button to select the input signal channel. 6. Select “Interval” option, turn the “Universal” knob to adjust time interval between record frames. 7.
Play Back: Play back current record waveforms or saved record waveforms. Table 60 - Waveform Playback Function Menu 1 Option Mode Operate Setting Play Back (Run) (Stop) Play Mode Interval Next Page Page 1/2 Instruction Set the Play Back function menu. Press to start playback playing. Press to stop playing. Set circular play mode. Set single time play mode. Set time interval between frames. Enter the second page of Play Back menu.
Table 61 - Waveform Playback Function Menu 2 Option Start Frame Curr_Frame Setting End Frame Return Next Page Page 2/2 Instruction Set start frame. Select current frame to be played. Set End frame. Press to return the waveform recorder main menu. Return to the first page of Play Back function menu. Figure 82 - Record Menu Screen 3 To play back current record waveforms, follow these steps: 1. Press UTILITY button to enter “Utility menu”. 2. Press the “Mode” option button to select “Play Back”. 3.
5. Press the “Next Page 1/2” to enter the second page of “Play Back function menu”. 6. Select the “Start Frame” option, turn the “Universal” knob to adjust the start frame of play back waveform. 7. Select the “End Frame” option, turn the “Universal” knob to adjust the end frame of play back waveform. 8. Press the “Next Page 2/2” option button to return the first page of “Play Back menu”. 9. Press the “ ” option button in “Operate” option to play back waveforms.
Figure 83 - Record Screen Table 63 - Waveform Recall Function Menu Option Previous Description Quit the auto-recalled waveform, then the waveform in EMS memory can be observed through altering the time base, the waveform in EMS memory can be moved left and right Recall the waveform again Next Fast forward play the recalled waveform again Return Quit the recalling interface Stop 154
Figure 84 - Replay Screen Table 64 - Recording Setting Menu Option Setting Description Viewer Full Screen Waveform of Full screen recording and channel recalling Waveform of recording on split screen and channel recalling, CH1 is displayed in upper halfscreen, CH2 is displayed in lower half-screen. Split Record Mode Roll Recorder saves the channel waveform persistently, the latter waveform will cover the former. recorder will stop waveform saving when its memory is up to 6M.
Roll When recalling, screen waveform will refresh completely according to the capturing time of each frame quit the recording setting interface Return Figure 85 - Option Screen Recorder Operation step: 1. Press the UTILITY button to enter “Utility menu”. 2. Press the “Next Page” option button to enter the four page of “Utility menu”. 3. Press the “Recorder” button to enter the Recorder manual. 4. Press the “Option” button to select the parameter which you want by yourself 5.
6. After finished record waveform, then Press the “Replay” button to view the recorded waveform. Online Help Function The oscilloscope has an online help function that supplies multi-language help information, and you can recall them to help you operate the oscilloscope when you need. Press the “HELP” button to enter the help status, then press every button to recall the corresponding help information.
Figure 86 - Help Menu Screen 158
Chapter 3 Application Examples This section presents a series of application examples. These simple examples highlight the features of the oscilloscope and give you ideas for using it to solve your own test problems.
Taking Simple Measurements Observe an unknown signal in a circuit, display the signal quickly and measure the frequency and peak-to-peak amplitude. 1. Using Auto set To quickly display a signal, follow these steps: - Press the CH1 button, set the Probe option attenuation to 10X and set the switch to 10X on the probe. - Connect the channel 1 probe to the signal. - Press the AUTO button. - The oscilloscope sets vertical, horizontal, and trigger controls automatically.
Measure signal frequency ● Input the signal to channel 1. ● Press the “AUTO” button. ● Press the “MEASURE” button to see “auto Measure Menu”. ● Press the top option button. ● Press the “Time” option button to enter the “Time Measure menu”. ● Press the “Source” option button to select input signal channel. ● Press the “Type” option button to select “Freq”. The corresponding icon and measure value will display on the third option area.
Taking Cursor Measurements You can use the cursors to take time and voltage measurements of a waveform quickly. Measuring Ring Frequency To measure the ring frequency at the rising edge of a signal, follow these steps: 3. Press the “CURSORS” button to see the “Cursor Menu”. 4. Press the “Mode” button to select “Manual”. 5. Press the “Type” option button and select “Time”. 6. Press the “Source” option button and select“CH1”. 7.
Figure 87 - Cursor Menu Screen 1 Measuring Ring Amplitude To measure the amplitude, follow these steps: 1. Press the “CURSORS” button to see the Cursor Menu. 2. Press the “Mode” button to select “Manual”. 3. Press the “Type” option button and select “Voltage”. 4. Press the “Source” option button and select “CH1”. 5. Press the “CurA” option button and turn the universal knob to place the cursor A on the highest peak of the ring. 6.
● The delta voltage (peak-to-peak voltage of the ringing) ● The voltage at Cursor A. ● The voltage at Cursor B. Figure 88 - Cursor Menu Screen 2 Capture a single event To capture a single event, you need to gather some knowledge of the signal in order to correctly set up the trigger level and slope. If you are not sure about the instance of the signal, you can observe it through auto or normal trigger mode to ensure the trigger level and slope will capture the signal.
1. Set the Probe option attenuation to 10X and set the switch to 10X on the probe. 2.
Analyzing the Signal Detail You have a noisy signal displayed on the oscilloscope and you need to know more about it. You suspect that the signal contains much more detail than you can now see in the display. Looking at a Noisy Signal The signal appears noisy and you suspect that noise is causing problems in your circuit. To analyze the noise better, follow these steps: 1) Press the “ACQUIRE” button to see the acquire menu.
3) Press the “Averages” option button to see the effects of varying the number of running averages on the waveform display. Averaging reduces random noise and makes it easier to see the details of a signal. Triggering on a Video Signal Observe the video circuit in a piece of medical equipment and use the video trigger to obtain a stable display.
Triggering on Video Lines To trigger on the video lines, follow these steps: 1. 2. 3. 4. 5. 6. Press the “TRIGGER MENU” button to see the trigger menu. Press the top “option” button and select “Video” Press the “Sync” option button and select “Line Num” and turn the universal knob to set a specific line number. Press the “Standard” option button and select “NTSC”. Turn the “Time/Div” knob to see a complete video line across the screen.
4. Connect the channel 1 probe to the input of the network, and connect the channel 2 probe to the output. 5. Press the “AUTO” button. 6. Turn the “Volts/div” knobs to display approximately the same amplitude signals on each channel. 7. Press the “DISPLAY” button. 8. Press the Format option button and select “XY”. 9. The oscilloscope displays a Lissajous pattern representing the input and output characteristics of the circuit. 10.
D A B C Sin θ=A/B or C/D where θ=phase shift (in degrees) between the two signals from the formula above, you could get: θ=±arcsine (A/B) or ±arcsine (C/D) If the main axis of the ellipse is at II and IV quadrant, θ must be in the range of (0-π/2) or (3π/2-2π). If the main axis is at I and III quadrant, θ must be in the range of (π/2-π) or (π-3π/2).
To activate the differential signals connected to channel 1 and channel 2, follow these steps: 1. Press the CH 1 button and set the Probe option attenuation to 10X. 2. Press the CH 2 button and set the Probe option attenuation to 10X. 3. Set the switches to 10X on the probes. 4. Press the AUTO button. 5. Press the “MATH” button to see the Math Menu. 6. Press the “Operation” option button and select “-”. 7.
Chapter 4 Message Prompts and Troubleshooting Message Prompts • Trig level at limit! : Prompts you that the trigger Level is at a limit when you turn the Trig level knob. • Horizon position at limit! : Prompts you that the horizontal position is at a limit when you turn the horizon position knob. • Volts/Div at limit! : Prompts you that the vertical voltage have already touched the Min 2MV/div or the Max 5V/div.
• No signal! : The system would display this information when the signal could not match the auto set condition. (Using in the auto set) • Adjust at limit! : You could adjust the pulse width by the universal knob till the pulse width has reached min 20.0 ns or max 10.0 s. • Location Empty! : If you have no stored waveforms or setups on some location, the screen will display this information when you press the “Recall” button on this location.
“Save/Recall” menu , Press the “Save” option button or the “time/div” knob before inverting the USB Flash Drive to the USB Host port or this will appear on the screen. • Record Wave Success! : This message will appear when you finish recording waveforms. Troubleshooting 1. After the oscilloscope is powered on, the screen remains dark. Please do the following: 1. Check the power cable’s connection. 2. Ensure the power switch is turned on. 3. After the inspections above, restart the oscilloscope. 4.
3. Check the probe whether it’s connected with the device under test (DUT) or not. 4. Check the tested DUT to see if it produces the signal or not. 5. 3. Try to probe the DUT for signal again. The value of the tested voltage is 10 times higher/lower than the real one , please do the following: Check the attenuation quotient whether it matches the probe attenuation proportion or not. 4. Display the wave, but not steady , please do as following steps: 1.
Check the trigger mode on the trigger interface whether or not it’s in “normal” or “single”, and check the trigger level whether or not it is over the wave range. If yes, please put the trigger level to the middle position or set the trigger mode to the “Auto” position. Another way is to choose the “Auto” button to set up automatically. 6. After the Acquisition is set to Averages or Display Persistence time is set too long, the waveform refreshes slowly. It is normal in these settings. 7.
Chapter 5 Specifications • All specifications apply to measurements with a 10X probe To verify that the oscilloscope meets specifications, the oscilloscope must first meet the following conditions: o The oscilloscope must have been operating continuously for thirty minutes within the specified operating temperature. o You must perform the Do Self Cal operation, accessible through the Utility menu, if the operating temperature changes by more than 5° C.
(Both channels in same V/div setting) Probe attenuator Probe attenuation selectable factors 1X, 10X 1X, 10X, 100X, 1000X Vertical System Vertical Sensitivity Channel voltage offset range 2 mV/div – 10 V/div (1-2-5 order) 2 mV–100 mV: ±2 V 102 mV – 10 V: ±40 V Vertical Resolution Channels Analog Bandwidth Single-shot Bandwidth Lower frequency limit (AC coupled) DC Gain Accuracy 8 bit 2 25 MHz 40 MHz 25 MHz 40 MHz DC Measurement Accuracy: All Gain settings ≤100mV/div DC Measurement Accuracy: All Gain
Horizontal System Real Time Sampling Rate Single Channel: 500 MSa/s Dual Channel: 250 MSa/s (when timebase is faster than 250 nS/div) Highest Equivalent Sampling Rate 10 GSa/s. 25 GSa/s Measure Display Modes MAIN, WINDOW, WINDOW ZOOM, ROLL, X-Y Timebase Accuracy ±100ppm measured over 1ms interval Horizontal Scan Range 25 nS/DIV – 10 nS/DIV – 50 S/DIV 50 S/DIV Scan Mode: 100 mS/DIV – 50 S/DIV (1-2.
Trigger Sensitivity Pulse Width Trigger Video Trigger Slope Trigger Alternative Trigger For fixed gain ranges 1 Divisions: DC-10 MHz 1.5 Divisions: 10 MHz – max. bandwidth EXT: 200 mVpp DC-10 MHz, 300 mVpp 10 MHz – max. bandwidth EXT/5: 1 Vpp DC-10 MHz, 1.5 Vpp 10 MHz - max.
15 min, 30 min, 1 hour, 2 hour, 5 hour Classical, Modern, Tradition, Succinct Sin(x)/x, Linear Normal , Invert Simplified Chinese, Traditional Chinese, English, Arabic, French, German, Russian, Spanish, Portuguese, Japanese, Korean, Italian Skin Waveform interpolation Color model Language X-Y Mode X-pole Input / Y-Pole Input Phase Error Channel 1 (CH1) / Channel 2 (CH2) ± 3 degrees Hardware Frequency Counter Reading resolution 6 Bytes Accuracy ±0.
Control Panel Function Auto Set Auto adjusting the Vertical, Horizontal system and Trigger Position Save/Recall save/recall 2 referenced waveforms, 20 setups, and 10 captured waveforms to/from internal memory or to external USB flash drive. Power Supply Input Voltage Frequency Range Power 100-240 VAC, CAT II, Auto selection 45Hz to 440Hz 50VA Max Mechanical Dimensions (WxDxH) 12 x 6.3 x 5.2 inches (305 x 160 x 133 mm) Weight About 5 lbs (2.
Certification CE Compliant CE Declaration of Conformity The oscilloscope meets the requirements of 2006/95/EC Low Voltage Directive and 2004/108/EC Electromagnet Compatibility Directive. Low Voltage Directive - EN61010-1: 2001 Safety requirements for electrical equipment for measurement, control, and laboratory use. The oscilloscope meets the following: - - Installation Categories II (Supply Connector) and I (Measuring Terminals). Pollution Degree 2 (Normally only dry nonconductive pollution occurs.
Appendix A Default Setup Menu or system Options, knobs or buttons Default setup CH1,CH2 Coupling DC Volts/div Coarse Probe 1X Invert Off Filter Off Volts/div 1.00V Operation CH1+CH2 CH1 Invert Off CH2 Invert Off MATH FFT operation: HORIZONTAL CURSOR Source Window FFT Zoom Scale Display CH1 Hanning 1X dBVrms Split Window Main Position 0.00μs Time/div 500μs Window Zone 50.0μs Trigger knob level Type Off Source CH1 Horizontal (voltage) +/- 3.
MEASURE ACQUIRE DISPLAY Source CH1 Type average three mode options Sampling Averages Sampling mode 16 Real Time Type Vectors Persist off Gird SAVE/RECALL REF UTILITY TRIGGER (edge) Intensity 60% Brightness 40% Format YT Menu Display infinite Type Setups Save To Device Setup No.
TRIGGER (pulse) TRIGGER (Video) TRIGGER (Slope) TRIGGER (Alternative) Coupling DC LEVEL 0.00V Type pulse Source CH1 When = Set Pulse Width 1.00ms Mode Auto Coupling DC Type Video Source CH1 Polarity Normal Sync All Lines Standard NTSC Mode Auto Type Slope Source CH1 Time 1.
Appendix B Index - Width, 109 + Width, 109 Alternative Trigger, 74 Auto set, 27 Blackman, 48 Counter, 131 Coupling, 32 Creating Folders and Files, 116 DEFAULT SETUP, 29 Digital Filter, 40 EXT TRIG, 26 Fall, 109 FFT, 44 Filter, 33 Hanning, 48 Help, 160 Keyboard Test, 143 Language, 131 Math Functions, 42 Pass/Fail, 146 Peak Detect, 84 Persist, 91 Polarity, 67 Probe Attenuation, 20 Probe Compensation, 20 Pulse Trigger, 64 Recalling Files, 115 REF, 53 Rise, 109 S/div, 56 Sampling, 84 Save Picture, 126 Screen T
Appendix C Disabling Auto Function The 2530B/2532B has the ability to disable the Auto button that would automatically setup the scope to display a signal, circumventing the need to know how to set up scope parameters. This feature could be used by educators as a teaching tool for basic oscilloscope operation. To receive information on how to disable this Auto button function, please contact B&K Precision at http://www.bkprecision.com/contact_us .
SERVICE INFORMATION Warranty Service: Please go the support and service section on our website www.bkprecision.com to obtain a RMA #. Return the product in the original packaging with proof of purchase to the address below. Clearly state on the RMA the performance problem and return any leads, probes, connectors and accessories that you are using with the device. Non-Warranty Service: Please go the support and service section on our website www.bkprecision.com to obtain a RMA #.
LIMITED ONE-YEAR/THREEYEAR WARRANTY B&K Precision Corp. warrants to the original purchaser that its products and the component parts thereof, will be free from defects in workmanship and materials for a period of one year (for model 2530B) and three years (for model 2532B) from date of purchase. B&K Precision Corp. will, without charge, repair or replace, at its option, defective product or component parts. Returned product must be accompanied by proof of the purchase date in the form of a sales receipt.
22820 Savi Ranch Parkway Yorba Linda, CA 92887 www.bkprecision.com © 2011 B&K Precision Corp.