
Owner's Manual


IQ Chek
Software Manual
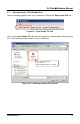
GRAPH RESULTS TOOLBAR: From the Graph Results toolbar, click on the save
button to save the file in YVG format to your PC. When viewing the graph, you can
save the file in other formats as well. By clicking on the statistics and data table tabs,
the user can see them respectively and save the graphs using the Save Graph icon.
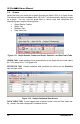
For changing the graph settings, manipulating data, printing, and saving data files into
different formats, use the following toolbar items.
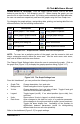
Icon Description Icon Description
Save graph in .YVG format
Copy graph to clipboard
Save graph in graphic format
Change graph settings
Save graph in PDF format
Undo previous zoom
Opens print dialog box
Redo zoom action
Print preview
Undo all previous zooms
Figure 3-15. Graph Results Toolbar and Icon Descriptions
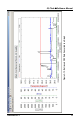
NOTE: To zoom into a particular portion of the graph, use the mouse to click and
drag a rectangular area to define the zoom area. Use the undo zoom, redo zoom,
and undo all buttons with the zoom feature.
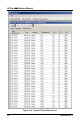
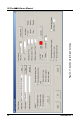
The Change Graph Settings button allows the user to customize the graph. Click on
the graph icon (Figure 3-16) to display the graph properties dialog (Figure 3-17).
Figure 3-16. T
he Graph Settings Icon
From this “dashboard”, you can perform the following functions.
Graph Title: Change description, font, and color.
Background: Select background color of graph area.
X-Axis: Change description, font, and color of label. Toggle X-axis grid
lines and X-axis markers separately.
Legend: Toggle legend (on/off). If on, select position (top or side), font,
and color.
Units: Show units on X-axis, in legend, or at both locations.
Data Lines: Allow changes to the data line color of a particular parameter.
Allow changes to line style and width to make it more prominent.
Toggle the alarm display line. Availability of line markers to
differentiate between parameters (useful for distinguishing
different data lines on non-color printouts).
Refer to the dashboard (Figure 3-17) for graph settings.
1509-9002 Rev 1 15