FasTrac Millennium User’s Guide
FasTrac Millennium User’s Guide – May 2003 FasTrac Millennium, FasTrac, NexTrac, VIPIR, City Streets, StormScan, Storm Spotter, Neighborhood Weather Net and Street Spotter are registered trademarks of Baron Services, Inc. FutureScan, PasTrac and Severe Weather Module are trademarks of Baron Services, Inc. The products, systems, and/or methods described or otherwise mentioned herein are covered by one or more of the following U.S.
FasTrac Millennium User’s Guide – May 2003 Table of Contents Table of Contents___________________________________________________________iii Preface_____________________________________________________________________ vii 1. Overview ________________________________________________________________ 1 1.1 Databases ___________________________________________________________ 1 1.2 File Structure ________________________________________________________ 1 1.
FasTrac Millennium User’s Guide – May 2003 3. Adjusting Views__________________________________________________________ 33 3.1 Using the View Main Panel____________________________________________ 34 3.2 Setting Map Parameters ______________________________________________ 35 3.3 Editing Topographical Data ___________________________________________ 36 3.4 Saving and Organizing Views__________________________________________ 37 3.4.
FasTrac Millennium User’s Guide – May 2003 4.5 Using PasTrac ______________________________________________________ 66 4.5.1 Auto-Tracking Real-Time Radar Data ________________________________ 66 4.5.2 Auto-Tracking NEXRAD Data ______________________________________ 66 4.6 Identifying Storms with StormScan_____________________________________ 4.6.1 Setting Up StormScan _____________________________________________ 4.6.2 Using Storm Marquees ____________________________________________ 4.6.
FasTrac Millennium User’s Guide – May 2003 6.4 Utilizing Multiple Real-Time Radars Via Network ________________________ 98 6.4.1 Using Network America ___________________________________________ 98 6.4.2 Changing the Width of the Radar Sweep Cursor_________________________ 98 6.5 Comparing Base Reflectivity and Composite Reflectivity ___________________ 99 6.
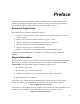
Preface This manual describes the operating procedures for Baron Services’ FasTrac Millennium software, the industry standard for display and storm tracking. You can use these products to present critical weather data that will provide customized weather displays. Document Organization The information in this manual is organized as follows: Chapter 1 is a general overview of the system and provides the information needed to start the program.
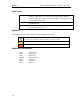
FasTrac Millennium User’s Guide – May 2003 Preface Type Faces Italic Bold Courier Indicates a document title, the first occurrence of a new term, a directory or file name, or a system response that explains what the system is doing. For example: Open the example cities.bmp file in your C:\fastrac\places directory. Indicates an item in the graphical interface, such as the OK button or a command button. Indicates information you type. For example, Set the signal processor parameters by typing SOPRM.
FasTrac Millennium User’s Guide – May 2003 Preface Terminology Click Double click Click and drag Enter Identify Click and hold Scroll Select Type To position the pointer on the screen, and then to press and quickly release the left mouse button. To quickly press and release a mouse button twice without moving the mouse. This action is used as a shortcut for common actions, such as activating an icon, opening a file, or selecting a word or graphic element.
1. Overview This manual describes the FasTrac Millennium product. FasTrac Millennium is the industry standard for providing real-time, local weather information to your users, allowing you to analyze real-time radar and to translate it into meaningful predictions of potentially harmful weather phenomena for your community. It also provides NEXRAD data, combining exceptional resolution, topography, and street-level mapping with Baron’s unique, intuitive user interface.
FasTrac Millennium User’s Guide – May 2003 Overview File or Directory Name Omninet.ini file Overlays directory Places directory Views.ini file Zooms directory Description The main configuration file. The directory that contains bitmap files that can be placed on the screen. The directory that contains the data files for all the communities in the Places database. The View configuration file that contains parameters for every saved view.
FasTrac Millennium User’s Guide – May 2003 Overview exiting the program, you may not return to it by clicking on the icon. You must click on the minimized icon on the task bar to return to the program. This safety feature is designed to prevent multiple copies of FasTrac Millennium from running at the same time. 1.4 NetRad The NetRad module lets you specify which radar sites provide NEXRAD data to your system. You must enable it before starting FasTrac Millennium, as described in this section. 1.
Overview 1.5 FasTrac Millennium User’s Guide – May 2003 Starting Your FasTrac Millennium FasTrac Millennium automatically starts up when you boot up the computer. To manually start, double-click on the FasTrac desktop icon (shown on the right). Either method displays the following main FasTrac screen: To exit the program, select File > Exit or click the Close (X) button in the upper-right corner of the screen. Subsequent paragraphs describe each screen component.
FasTrac Millennium User’s Guide – May 2003 Overview Temporary Text opens the Temporary Text dialog box, which lets you key in text that displays when you click OK and click on the text location. Lightning replays the lightning in the past hour. Right-click on this hot button to disable Lightning. Note that the button changes to the button shown on the right. This button blinks when the connection to the TCP/IP lightning server is down. Sweep displays real-time radar data.
FasTrac Millennium User’s Guide – May 2003 Overview StormScan activates the Arrow Filter panel on the left side of the FasTrac display. See Section 4.6, StormScan, for more details. Street Spotter allows you to find and label the streets in your database. See Section 3.5.4 for details. SpotterNet lets you display a network of eyewitnesses for weather activity. See Section 3.5.19 for details. Main Status Area The Main Status Area is the area in white, just to the right of the hot buttons.
FasTrac Millennium User’s Guide – May 2003 Overview More Settings The More Settings area, which appears at the bottom of the left column when the View panels are active, lets you display the following panels: Option Description MAP Controls street, road, water, and county line displays for the current view. DATA Controls appearance of radar and lightning data on the current view. The Radar Control option lets you control the real-time radar.
FasTrac Millennium User’s Guide – May 2003 Overview 1.7 Points to Remember When you start your system, you automatically enter the FasTrac environment. If you have exited FasTrac, you can double-click on the FasTrac icon on your desktop to manually initialize FasTrac. Perform back-up operations often, to protect your data and setup configurations. All of the operations that you may use are covered in this manual. If you find something that is not discussed, it is best not to tamper with it.
2. Setting Up Your System This chapter describes how to prepare your system for displaying crucial weather data in meaningful formats for your users. While you can readily perform most of the Setup commands, some operations are not so apparent. Before you start setting up, you should back up the delivered \fastrac directory as explained in section 1.3, Protecting Your Data.
Setting Up Your System 2.1 FasTrac Millennium User’s Guide – May 2003 Setting Up Map Layers The Map layer editor menu, which you can access with the Setup > Map > Map Layers command, allows you to edit the appearance and viewing range of all the water and road types in your map database, as well as county and state lines. Clients without .psf mapping data should use the Display Levels commands detailed in Section 2.2 to adjust the appearance of roads and water.
FasTrac Millennium User’s Guide – May 2003 Setting Up Your System 2.2.1 Editing Display Levels for Roads (for clients without .psf mapping data) Select the Setup > Map > Advanced > Display Levels > 1:2,000,000 Roads command to open the 1:2,000,000 Road Display Levels menu. This menu has nine categories reflecting different levels, or subsets, of roads. The Cutoff Range area lets you activate the databases at different ranges so that an appropriate amount of detail appears, regardless of range.
FasTrac Millennium User’s Guide – May 2003 Setting Up Your System The Display Style area lets you adjust the graphic look of the roads in your system. There are six graphic styles: Road Style Type Smallest Single Line Small Single Line Medium Double Line Major Double Line Divided Triple Line Two Color Triple Line Example Triple-line styles are usually assigned to interstates, and divided highways and double-line styles are usually assigned to state and county highways.
FasTrac Millennium User’s Guide – May 2003 2.2.3 Setting Up Your System Setting the Enable Range for City Streets (for clients without .psf mapping data) Select the Setup > Map > Advanced > Display Levels > City Streets Range command to open the City Street Maximum Enable Range menu. This menu lets you set the range threshold at which the system will move between the 1:2,000,000 database and the City Streets database.
Setting Up Your System FasTrac Millennium User’s Guide – May 2003 3. Select the Setup > Map > Advanced > Water Fill command to display the Setup Water Fill panel on the left side of the screen. Zoom Out automatically zooms out the map display to 50% of the current range. You can continue to issue this command until you have the appropriate view. Add Line opens the Add Water Fill Line dialog box. This dialog box lets you fix the display of two separate bodies of water.
FasTrac Millennium User’s Guide – May 2003 Setting Up Your System 5. Verify that the water body is filled with the water color. The following example depicts the water fill. Note that the water-fill point appears as a small white square on the map For best results, click near the center of the water body, away from the boundary lines. 6. Zoom out to ensure that the entire body of water is filled in correctly, as shown in the following example. Notice that multiple water-fill points have been added.
Setting Up Your System FasTrac Millennium User’s Guide – May 2003 2.4 Fixing Floods with Anti-Fill Points (for clients without .psf mapping data) Sometimes when filling a large body of water with water-fill points, you may accidentally place a point that makes the land area fill with the blue color. This is referred to as a flood. Since it can be difficult to find the particular fill point that is causing the flood, the Baron program allows you to use Anti-Fill command to fix the problem. 1.
FasTrac Millennium User’s Guide – May 2003 Setting Up Your System 2. Click on a state name, and click OK to open the Place List for the selected state. Note that all the populated communities in the selected state are listed alphabetically. 3. Click Add to create a new place, or click an existing place name and click Edit to modify it. The Add Place and Edit Place menus have identical features, although a place you edit will already have information filled in.
Setting Up Your System FasTrac Millennium User’s Guide – May 2003 Show Range – Defines the range, in miles, at which the place will display. For example, a place with a Show Range parameter of 1 will not display until your view range is one mile or less. Show on maps – Displays the place name on views when it is in range. Show on Storm Tracks – Displays the place name on Storm Track ETA displays. Original Data – Reserved for future use. When adding places, do not start them with a number (e.g.
FasTrac Millennium User’s Guide – May 2003 Setting Up Your System 9. Repeat steps 2 through 8 to set up map displays for 200-, 150-, 100-, 75-, 50-, 25-, 10-, 5-, and 3-mile ranges. 10. Repeat steps 1 through 9 for each important city in your viewing area. 11. Verify that you have a good coverage of the cities you want to see by zooming in and out on relevant areas of your viewing area. Customizing the Places Database Many of our clients have gone beyond editing to customizing their Places Database.
Setting Up Your System 2.6 FasTrac Millennium User’s Guide – May 2003 Adjusting the Color Palette The Setup > Colors command lets you adjust the color palette used by FasTrac Millennium. If you have access to the Advanced Baron Chart (via the Setup > Data > Baron Chart command, see section 6.3.3), you should use it rather than the Setup Colors menu to adjust radar colors. Also, you should use the Setup > Map > Map Layers command discussed in section 2.1 to adjust mapping colors.
FasTrac Millennium User’s Guide – May 2003 2.7 Setting Up Your System Using the Baron Chart The Baron Chart lets you specify the colors used for the various NEXRAD products and your real-time radar data. All of these use the Baron Chart. To display it, select Setup > Colors to open the Setup Colors menu, and select Baron Chart. The square on the right shows all 256 colors in the color palette.
Setting Up Your System FasTrac Millennium User’s Guide – May 2003 displays text that identifies the colors used. The following steps describe how to change a particular level in a product: 1. Select a color for a particular level from the palette by clicking on a color on the Baron Chart. 2. Click on the level that you want to change (for example, level 7 of VIL). 3. Click OK to save your edit and to return to the Setup Colors menu. You can change any MODIFIABLE color on the palette.
FasTrac Millennium User’s Guide – May 2003 2.8.1 Setting Up Your System Creating Gradients The Normal Gradient and HSL Gradient buttons let you automatically create a smooth scale of colors between two entries on a palette. 1. Manually edit the colors of the palette entries that you wish to be the starting and ending points of the gradient, using the Edit Color button. 2.
Setting Up Your System FasTrac Millennium User’s Guide – May 2003 You only need to use the Level mapping area if the palette you are duplicating is a 16-color palette. In the text boxes, type the number in the 256-color range that you wish each of the 16level colors to appear. The Use reflectivity mapping button automatically assigns reflectivity values and colors to the target palette. To assign the new color scheme, click OK. To exit without changing the palette, click Cancel. 2.
FasTrac Millennium User’s Guide – May 2003 Setting Up Your System 2.10 Manipulating the Automatic Legend Use the options under the Legend menu to control the automatic legend, shown below. DISPLAY lets you toggle the automatic legend on and off. When the legend is on, a check appears next to this option. RAIN MODES lets you display rain, snow, and mixed weather in the legend. RESIZABLE BORDER lets you adjust the size of the legend for the best fit on maps.
Setting Up Your System FasTrac Millennium User’s Guide – May 2003 2.11 Using Overlays The Tools-1 > Overlay > Add Overlay and Tools-1 > Overlay > DragDrop Overlay commands let you bring logos, customized legends, or other kinds of pictures into your system, and then place them on your map at a specific pixel location. Overlays retain their screen position, no matter how you switch your views. 2.11.1 Creating new Overlays 1.
FasTrac Millennium User’s Guide – May 2003 Setting Up Your System For the Add Overlay procedure, follow these steps: 1. Select the Tools-1 > Overlay > Add Overlay command to open the OVERLAY LIST. 2. Select the overlay you want to place on screen from the list by left-clicking it. 3. In the text box labeled Transparency, select the amount that you want the overlay to move behind other screen elements (0 is least and 100 is most). 4. Press ENTER or click OK to close the menu. 5.
Setting Up Your System 2.11.3 FasTrac Millennium User’s Guide – May 2003 Removing Overlays When you wish to remove a fixed overlay from the screen, follow these steps: 1. Select the Tools-1 > Overlay > Remove Overlay command to open the Remove Overlay menu. 2. Left-click on the overlay you wish to remove. 3. Press ENTER or click OK to close the menu. The overlay will then disappear.
FasTrac Millennium User’s Guide – May 2003 2.11.5 Setting Up Your System Setting the FutureScan Product Overlay For clients with the FutureScan module (see section 3.5.11), the FutureScan product is automatically associated with a bitmap labeled futurescan.bmp. You should therefore check to ensure that this bitmap is in your fastrac/overlays folder. You can control the appearance of the FutureScan overlay through the FutureScan Overlay menu.
Setting Up Your System FasTrac Millennium User’s Guide – May 2003 4. Either way, a menu labeled Icon appears. Enter the name you wish to associate with the icon in the Name text box. 5. Enter the filename for the picture you wish to use for the icon, or click the Browse button to select it from a menu. 6. Click the Preview Bitmap button to verify that you have selected the picture you wanted for the icon. 7.
FasTrac Millennium User’s Guide – May 2003 Setting Up Your System 2.13 Points to Remember Before you make any major changes, back up your \fastrac directory and subdirectories. One of the most important commands is the Setup > Map > Map Layers command, which controls the roads and bodies of water that appear on your map display. For systems without .psf mapping data, the Display Levels, Water Fill, and Anti-Fill commands control the appearance of roads and water.
3. Adjusting Views This chapter describes how to control the display of your weather map displays, or views. Views control how your weather data is presented.
Adjusting Views 3.1 FasTrac Millennium User’s Guide – May 2003 Using the View Main Panel The View Main window is the first panel available upon opening the program. (The name of the current view window is always at the top of the window.) Buttons for the four other windows appear in the More Settings area at the bottom of the panel. If you are currently viewing another panel, the Views button is always available in the Select Panel area.
FasTrac Millennium User’s Guide – May 2003 Adjusting Views 4. Click the Previous button on the Main View panel to return to your base view, and then zoom in to the next area of interest. Once you are comfortable with using this sequence to present storm views, you will want to use it often. Many broadcast clients use the Previous button as a quick map switch, as shown in the following example. Assume that you are doing a short cut-in before going on the air. 1.
Adjusting Views FasTrac Millennium User’s Guide – May 2003 Places controls the display of city names. Show turns on and turns off the display of community names. Normally, the system uses the default settings you established with the Setup > Map > Places Database command (see section 2.4, Editing the Places Database). To override the default settings, key in a new level in the Level text box, and click Update. Click Lock to set the specified priority level for future pans and zooms.
FasTrac Millennium User’s Guide – May 2003 3.4 Adjusting Views Saving and Organizing Views This section describes how to save and organize your views. 3.4.1 Saving Views Once you have all the parameters defined for a given view, you will want to save it. When saving a view, you have the option of just saving the view or of saving the view as a bitmap file. For most purposes, the liquid databases are such powerful tools that there is little need to save a large number of views.
FasTrac Millennium User’s Guide – May 2003 Adjusting Views Whenever you are saving views, it is very important to use a consistent naming convention. We recommend the name (or abbreviation) of the community closest to the center of the view and the range of the view. For example, you could save a 150-mile view that is centered over Huntsville, Alabama as HSV 150. This naming convention makes it easy to identify what the saved views represent.
FasTrac Millennium User’s Guide – May 2003 Adjusting Views View > Export saves the current view to a floppy disk or your hard drive. You may then transfer the view to your IRIS computer and post the view on the Internet. When you select this option, the menu to the right appears, which contains instructions on preparing views for exporting.
FasTrac Millennium User’s Guide – May 2003 Adjusting Views and click on the new center. 3.5.5 Labeling Streets with Street Spotter The Street Spotter feature allows you to locate and label important streets and landmarks. Basic Operation 1. To activate Street Spotter, click on the Street Spotter hot button. The cursor icon will then change to a small arrow above a two-lane street. You will use this cursor to perform Street Spotter operations. 2.
FasTrac Millennium User’s Guide – May 2003 Adjusting Views Undo last removes the most recently placed Street Spotter text. You can use this option as many times as there are blocks of text, even if you change the view after placing text. Clear all removes all Street Spotter text from the view. Find opens the Locate Street or Intersection menu, as explained in the next section. OK saves changes and closes the menu. Cancel closes the menu without saving changes.
Adjusting Views FasTrac Millennium User’s Guide – May 2003 9. Click OK when you have made your selections. After a few seconds, a new view at the specified zoom range will appear, centered either on the intersection or on some point on the street. The streets will be shown in the colors that you selected for them. 3.5.
FasTrac Millennium User’s Guide – May 2003 Adjusting Views hold down the button on the pen, and drag the cursor to where you want the line to end. To change line colors quickly, click the right mouse button. The colors appear in the order: red, blue, green, yellow, white, black, purple, cyan, and gray. You can change additional settings with the Telestrator Pen Information menu, which you can open by right clicking on the TeleTrac hot button.
Adjusting Views FasTrac Millennium User’s Guide – May 2003 Positive refers to the cloud-to-ground movement of lightning. Negative refers to the ground-to-cloud movement of lightning. Hot refers to a strike that occurred less than five minutes previously. * Warm indicates a strike that hit between five and ten minutes previously. * Cold refers to a strike that occurred between ten and fifteen minutes previously. * *The fade times for these attributes are user-definable in the omninet.ini file.
FasTrac Millennium User’s Guide – May 2003 3.5.10 Adjusting Views Toggling High-Definition Data Processing The High Definition Data Processing (HDDP) feature creates clearer NEXRAD displays than those available with the normal pixilated display. The HDDP display is generated in real time without loss of accuracy as shown in the following comparison: Normal, Pixilated Display HDDP Display To enable high-definition processing, select Radar > High Definition.
Adjusting Views 3.5.12 FasTrac Millennium User’s Guide – May 2003 Displaying Neighborhood Weather Net Sensor Data You can use the Neighborhood Weather Net (NWN) interface to show NWN sensor data on your maps. NWN provides non-storm related data, such as temperature, humidity, wind speed, wind direction, and barometric pressure. Setting Up Locations to Receive Data 1. Select Setup > Data > Advanced > NWN Interface to open the NWN Locations menu.
FasTrac Millennium User’s Guide – May 2003 Adjusting Views 2. When you have completed editing locations, click Done. 3. Select Setup > Fonts > Temp Text to specify the font size, type, and color. Setting Data Thresholds You can set the minimum and maximum values that will display for an NWN data item with the Sensor Thresholds menu. Open this menu by selecting the Setup > Data > Advanced > NWN Thresholds command. There are two additional data types for which you can set thresholds.
Adjusting Views 3.5.13 FasTrac Millennium User’s Guide – May 2003 Zooming to a Specific City The Find City feature allows you to automatically zoom to any city in your database at a selected range. 1. Select Tools-1 > Find City to open the Find City menu. 2. In the text box labeled Community Name, type in the name of the community you wish to focus on. 3.
FasTrac Millennium User’s Guide – May 2003 3.5.15 Adjusting Views Creating Temporary Pixel Query Points Using the Map Pointer hot button, you can create text messages that indicate the severity of various types of radar data such as reflectivity. These messages are known as pixel query points. To begin the process of adding pixel query points, right-click on the Map Pointer hot button to enter pixel query mode.
Adjusting Views FasTrac Millennium User’s Guide – May 2003 To temporarily hide your fixed pixel query points, uncheck the box at the top of the Query Points menu labeled Display points. To permanently remove a fixed pixel query point, select it from the list in the Query Points menu and click Remove. 3.5.
FasTrac Millennium User’s Guide – May 2003 Adjusting Views Setting Up the Precip Type Background While your precipitation type map is set up for you upon delivery, you may have to adjust it during troubleshooting procedures. To open the Precip Type Setup menu, select Setup > Data > Precip Type Map. The only items you should change are the Line Width and Fill Colors settings. The Line Width text box lets you set the width (in pixels) of the boundary lines you draw between precipitation types.
Adjusting Views 3.5.20 FasTrac Millennium User’s Guide – May 2003 Highlighting Your Spotter Network On-Air The SpotterNet feature, which Millennium users can access through the SpotterNet hot button, gives you the opportunity to show the positions of your storm spotters in the field to your viewers. Setting Up Your SpotterNet Database 1. Right-click the SpotterNet hot button to open the SpotterNet Database menu. 2. The existing list of spotters appears in the pull-down list at the top of the menu.
FasTrac Millennium User’s Guide – May 2003 3.5.21 Adjusting Views Displaying National Weather Service Warnings Using the Weather Wire Data hot button, you can control the display of National Weather Service warnings for counties in your viewing area. Left clicking the button opens the Warnings Display panel, which shows the current alerts that are in effect, which counties are involved and when the alerts expire.
Adjusting Views 3.5.22 FasTrac Millennium User’s Guide – May 2003 Displaying Wind Speed and Direction The Wind Display feature allows you to quickly show the speed and direction of winds at various elevations over your broadcast area. The Rapid Update Cycle Model (RUC) provides wind data. The RUC is an operational atmospheric prediction system comprising primarily of a numerical forecast model and an analysis system to initialize that model.
FasTrac Millennium User’s Guide – May 2003 Adjusting Views • Step (knots) changes the number by which the levels of wind speed increment when you are in streamlines mode. For example, if you have 10 entered in the Step box, the legend will change to increments of 10 knots each, up to 140 knots. Entering 12 will produce increments of 12 and a maxiumum of 168 knots. • The Height area contains a slider bar that allows you to change the height at which winds are being measured.
Adjusting Views 3.6 FasTrac Millennium User’s Guide – May 2003 Points to Remember The panels shown on the left side of the display can be used to change commands that were specified by the Setup commands. Changing parameters through these panels is often a faster and more efficient way to control your display. Use the Radius setting on the Main View panel to specify your map range. Use the View Map Features panel to control map features, such as roads and rivers.
4. Managing Storm Tracks We designed the new series of FasTrac, as its name implies, to provide you with the fastest, most detailed tracking of storms. You will find storm tracking an easy, instantaneous process with some truly inventive features.
Managing Storm Tracks 4.1 FasTrac Millennium User’s Guide – May 2003 Setting Defaults for Storm Tracks The Setup > Storm > Storm Track command, which opens the Storm Track Setup menu, lets you establish default settings for storm tracking. In essence, you determine the original settings (defaults) for each storm track and then individually adjust parameters to meet your needs. INITIAL TRACK DURATION specifies the length, in minutes, of the tracking period.
FasTrac Millennium User’s Guide – May 2003 Managing Storm Tracks ETA BOX NUMBER OF LINES specifies the size, in lines, of the ETA box graphics. For example, to display eight communities, enter 8. PLACES SHOW RANGE ZERO CUTOFF specifies at which range every community appears. For example, if you create a storm projection based on a 60-mile view and have all the communities posted, your projection would be crowded by locations.
Managing Storm Tracks FasTrac Millennium User’s Guide – May 2003 4. When the direction and speed displayed in the status area match the known storm conditions, release the mouse button to display the storm projection. The marquee will appear at the position defined by the ETA BOX LEFT OFFSET and ETA BOX TOP OFFSET variables on the Storm Track Setup menu (see section 4.1). 4.2.
FasTrac Millennium User’s Guide – May 2003 4.2.3 Managing Storm Tracks Creating Squall Projections Squall projections track the progress of a line of storms. 1. Zoom in on the storm that is to be tracked, as shown in the following example: 2. Select Storm > Add > Squall from the Storm menu to add the squall projection.
Managing Storm Tracks FasTrac Millennium User’s Guide – May 2003 3. Click and drag your mouse to define the height of the storm and the two points that define the northernmost and southernmost edges of the storm. If the storm is moving north or south, define the width of the storm and the easternmost and westernmost points. In both cases, you will define a line that is perpendicular to the storm’s movement (shown in the following figure as line 1-2). 4.
FasTrac Millennium User’s Guide – May 2003 Managing Storm Tracks 5. Release the mouse to display the squall projection, as shown in the following example. If the projection is smaller than your default criteria for posting, you will see nothing, but the parameters will display in the track area box. If you choose a closer view and the storm projection is within it, the projection will be posted. 4.2.4 Deleting Storm Tracks To remove the currently selected storm track, select Storm > Delete.
Managing Storm Tracks FasTrac Millennium User’s Guide – May 2003 Enable displays the current storm projection. It is possible, and in many cases preferable, to create a storm projection but not display it. In this manner, you can track a storm that has severe weather potential. Regardless, by deselecting Enable, you maintain the storm track in memory without actually posting it. Start Time refers to the time you made the storm projection. Make sure the computer time is accurate.
FasTrac Millennium User’s Guide – May 2003 4.4 Managing Storm Tracks Editing the Storm Marquee While the Storm Track panel is displayed, select the Places button to display the Storm Track Places panel. Place Box Visible lets you keep a storm projection but not post the storm marquee. Deselect Place Box Visible, and then click Update to hide the marquee.
Managing Storm Tracks FasTrac Millennium User’s Guide – May 2003 staying there through any map change until you move it again or delete it. You can also move the storm track marquee around by clicking on it, holding down the mouse button, and dragging it to the new location. The system holds in memory as many storm projections as you will ever use in one severe-weather event. 4.
FasTrac Millennium User’s Guide – May 2003 Managing Storm Tracks 5. Select the AutoTrac button. The status panel will indicate, “Replaying archived data for AutoTrac.” After a short pause, it will read, “Finished replay. Left-click on storm’s position.” 6. Carefully click the position of the storm during this archived sweep. Click only once. 7. After the system finishes the NEXRAD replay, carefully click on the new position for an instant auto-track. 4.
Managing Storm Tracks FasTrac Millennium User’s Guide – May 2003 The SCITs in the second table are derived from data provided by Baron Services algorithms: Description Color Code and RGB Value Storms with heavy rain, lightning, and hail PINK SevStormAttributeColor=255,0,255 Storms with wind shear ORANGE ShearAttributeColor=255,153,0 4.6.1 Setting Up StormScan 1) Open the NEXRAD Main panel, select Reflectivity or Composite and select Auto Update on the NEXRAD More panel (NEXRAD page 2).
FasTrac Millennium User’s Guide – May 2003 4.6.2 Managing Storm Tracks Using Storm Marquees Right-clicking on the base of the storm arrow displays the marquee for the storm. The marquee is similar in style to the storm ETA box, but it gives information about the storm. This information includes storm direction, speed, max dBZ level, height, VIL level, top altitude, probability of hail, hail size, and whether it exhibits Tornado Vortex Signature (TVS) or mesocyclonic activity.
Managing Storm Tracks FasTrac Millennium User’s Guide – May 2003 Display Delta Values controls the feature that shows how much an attribute has changed for a particular storm since the previous sweep. Display NWS ID causes the marquee header to show the storm’s designation used by the National Weather Service. 4.6.3 Using the Storm Table Another useful feature of StormScan is the Storm Table, which is opened by right clicking on the Scan hot button.
FasTrac Millennium User’s Guide – May 2003 4.7 Managing Storm Tracks Creating Automatic Storm Sequences The Storm Sequence Main Menu has only one control: Go!. The area is restricted by the parameters you specify in the Setup > Storm > Storm Sequence command.
Managing Storm Tracks 4.8 FasTrac Millennium User’s Guide – May 2003 Points to Remember Before you begin to project storm tracks, use the Setup > Storm Track command to set up the default parameters. Determine what type of storm track will best depict the storm: fan, circle, or squall. Change your storm track display quickly through the Storm Track panel. Always select the Update option to put your changes into effect.
5. Using SEQUENCER The Storm Tracking system has a variety of functions that you may automate by using SEQUENCER capabilities. SEQUENCER lets you perform various operations, such as displaying various maps, repainting radar sweeps, zooming and panning from one map to another, and creating time lapses of radar and lightning data. When you group these functions in a sequence, they become events. You may permanently save sequences of zoom, pan, and timelapse events on the system for later use.
Using SEQUENCER 5.1 FasTrac Millennium User’s Guide – May 2003 Starting SEQUENCER To invoke SEQUENCER, click the Sequences button on the Select Panel at the left side of your display. The SEQUENCER panel then opens. While this panel is open, most non-sequence functions are inoperable. To exit the SEQUENCER panel, click EXIT. The SEQUENCER text box specifies the current sequence. To choose a different sequence, open the pull-down list and select another sequence.
FasTrac Millennium User’s Guide – May 2003 5.1.2 Using SEQUENCER Inserting New Events 1. If you have existing events and want to insert a new event, select the event under which you want to place the new event. 2. Click Ins Evt button to open a selection menu. You can use this command to create new events or to add existing events (such as zooms or time lapses created for other sequences). 3. Review the menu that appears, including such items as SLIDE, ZOOM, TIME LAPSE, RADAR, LIGHTNING, and NWN.
Using SEQUENCER FasTrac Millennium User’s Guide – May 2003 time lapse to electronic memory. This allows the system to display these frames at a higher speed upon recall. This operation may take several seconds. 2. SEQUENCER displays a window that describes the first event. This window also has three command buttons: Next, NonStop, and Abort. Next displays the next event. During the sequence, the machine will pause before each zoom or time lapse to load the event's frames.
FasTrac Millennium User’s Guide – May 2003 Using SEQUENCER centered over Athens, Alabama, and name it Athens 5. One suggested name of this zoom is HSV 150 to Athens 5. This naming convention makes it very easy to return to SEQUENCER, identify the pans and zooms you have created, and retrieve them for immediate use. The system uses the starting view parameters to determine the parameters of the other views.
Using SEQUENCER FasTrac Millennium User’s Guide – May 2003 and the ending view's name. It also contains the Preview, Edit Frames, and Del From Seq commands. 1. Click Preview. As your system loads the zoom frames, the Loading Frames message appears and remains during frame loading and the preview of the zoom frames. Unless you are previewing an event, this message does not appear on the screen during sequence play. 2. Click Edit Frames to display the event frame-by-frame. The Loading Frame message appears.
FasTrac Millennium User’s Guide – May 2003 5.3.1 Using SEQUENCER Creating Real-Time Radar Time-Lapses 1. Open SEQUENCER, and click Ins Evt to open the selection menu. 2. Double-click on the TIME LAPSE listing to open the Event List, which lists the available time lapses. If no time lapses are in the system, the list will be blank. 3. Click Create New to open the Radar Type menu. 4. Select REALTIME RADAR to open the Radar menu, which lets you define the radar parameters for a time lapse.
Using SEQUENCER 5.3.2 FasTrac Millennium User’s Guide – May 2003 Creating NEXRAD Time-Lapses 1. Configure your ingestor program (such as NetRad or WSIrad) to delete NEXRAD files that are older than four hours. (This will retain the setting and only needs to be set once.) The procedure is different for different programs. 2. Open SEQUENCER, and highlight the sequence's event after which you want to insert the time lapse.
FasTrac Millennium User’s Guide – May 2003 5.3.3 Using SEQUENCER Previewing Your Time Lapse After you create a time-lapse event, SEQUENCER adds the new event to the list on the SEQUENCER panel, which you can them preview. 1. Open the SEQUENCER panel. 2. Click the event name to open the menu that describes the lapse. This menu indicates all of the information that you entered for the lapse. 3. Click Preview. As the your system loads the lapse frames, a message displays Loading Frames.
Using SEQUENCER FasTrac Millennium User’s Guide – May 2003 3. Zoom in to the location where the heaviest rain occurred. 4. Do another time lapse over that location. This provides both the overview and the local weather information, which makes a difference to your viewers. 5.5 Repainting to a Sequence 1. Open SEQUENCER, and click Ins Evt to open the event types menu. 2. Double-click CONVENTIONAL RADAR. This will open the menu that we used earlier to create a time lapse. 3.
FasTrac Millennium User’s Guide – May 2003 Using SEQUENCER You should insert this event after a slide/view event. The system will continue to be in NEXRAD mode until you activate a repaint event. Specifying a number of frames greater than 1 allows you to create a NEXRAD time-lapse that is always up to date. 5.8 Points to Remember Use SEQUENCER to display saved mapping scenarios, such as zooming into areas with critical weather and time lapses of radar and lightning data.
6. Controlling Your Radar This chapter describes how to control both Baron and non-Baron radars. Non-Baron radars are controlled through the Radar Control panel and Baron radars are controlled through the Radar Data Acquisition and Control System (RDACS).
Controlling Your Radar 6.1 FasTrac Millennium User’s Guide – May 2003 Controlling Your Non-Baron Radar If you have a Baron Radar Processor, you can use the procedures described in this section to control your radar’s range and operating mode. 1. Click the Views button on the Select Panel, then click the Data button on the More Settings panel. 2. Click the Radar Control button to open the Radar Control panel. Range specifies the radar’s range.
FasTrac Millennium User’s Guide – May 2003 Controlling Your Radar The Status > Rdac status command allows you to quickly ensure that your radar is connected and functioning properly. Click the Views button on the Select Panel, then click the Data button on the More Settings panel. Click the Radar Control button to open the RDACS Control panel. Range sets the range, in miles. In Doppler mode, the maximum range is usually 75 miles; in log mode, the range is usually 300 miles.
FasTrac Millennium User’s Guide – May 2003 Controlling Your Radar Mode specifies the radar mode. While not all modes are valid for all radar types and may not appear in the pull-down list, the following list describes the possible modes: Mode Powerdown Standby Long Log+Turb Single PRF Dual PRF VHD Description Radar electronics are off. Radar electronics are on, but the transmitter is off. Long pulse, no velocity, and range up to 300 miles. Log mode plus detection and display of turbulence in return data.
FasTrac Millennium User’s Guide – May 2003 Controlling Your Radar Linear Intensities controls which format of reflectivity data the radar uses when it is in one of the Doppler modes. Typically, early RDACS controllers leave it off and later controllers leave it on. On the early RDACS controllers (HDDS.EXE), both linear and log reflectivity data are available and the log data is usually of higher quality, so leave the Linear Intensities option unselected. On the newer RDACS controllers (H250S.
Controlling Your Radar • FasTrac Millennium User’s Guide – May 2003 Shear Markers displays two types of rings that represent the presence of significant shear. A yellow ring indicates that the shear is in level 2 or above, while a red ring indicates a Low Level Lock at level 1. Upper level shear markers appear when the wind shear reaches 50 knots. Low Level Lock appears when the wind shear reaches 50 knots at level 1 and 30 knots at level 2. • Arrows displays NWS and Baron Services SCITs.
FasTrac Millennium User’s Guide – May 2003 Controlling Your Radar The following table lists the code for each product.
Controlling Your Radar FasTrac Millennium User’s Guide – May 2003 Snow Machine: Product Name Snow Machine (1 km) [Precipitation Type/Rate] 4 km Precipitation Type Mask 1 Hourly Snow Accumulation 1 Hourly Mixed Accumulation 3 Hourly Snow Accumulation 3 Hourly Mixed Accumulation 12 Hourly Snow Accumulation 12 Hourly Mixed Accumulation 24 Hourly Snow Accumulation 24 Hourly Mixed Accumulation Heavy Snow (1 km) 1 Hourly Winter Precipitation 3 Hourly Winter Precipitation 12 Hourly Winter Precipitation Whole US
FasTrac Millennium User’s Guide – May 2003 Controlling Your Radar The following paragraphs describe most of the possible products: • Base Reflectivity displays the 150-mile reflectivity sweep of the site. This product is available only for the first four scans of the volume. • Composite Reflectivity shows the greatest reflectivity at a location, regardless of height. • Base Velocity displays wind speed and direction in reference to the radar beam.
Controlling Your Radar FasTrac Millennium User’s Guide – May 2003 • Pick lets you select a single frame from a list of archived frames. After you select a frame, use the < and > buttons to move the radar sweep forward or back one frame. Use this option to review data that is not current. • R/T switches the radar to real time to show new frames as they appear. • Off puts the system back into real-time radar mode (that is, your own radar’s sweeps start to display again and NEXRAD is deactivated).
FasTrac Millennium User’s Guide – May 2003 Controlling Your Radar New Lapse clears the screen each time you create a time-lapse with the Max option on. Include in Lapse moves the shear markers in time lapses, along with the displayed radar. Otherwise, the markers lock to the latest location. If you select Mosaic, Max and New Lapse simultaneously, the system displays the requested product lapse without erasing the prior frame. 6.3.
Controlling Your Radar 6.3.3 FasTrac Millennium User’s Guide – May 2003 Using the Advanced Baron Chart Any Advanced BSI Data Products you may purchase include an Advanced Baron Chart for NEXRAD products. You can open the Advanced Baron Chart with the Setup > Data > Baron Chart command. The Advanced Baron Chart allows you to change the default colors of any NEXRAD products you have. You may also display the Pixel Query status messages for NEXRAD products.
FasTrac Millennium User’s Guide – May 2003 Controlling Your Radar One of the important issues to remember when adding a Baron Chart entry is that the Baron Chart does not expect the elevation digit to be appended when you enter the product code. When you right-click on a button in the NEXRAD panel, the product code that appears has the elevation code appended.
Controlling Your Radar 6.4 FasTrac Millennium User’s Guide – May 2003 Utilizing Multiple Real-Time Radars Via Network The Network America system augments your real-time Doppler data by linking to multiple Doppler sites (including your own real-time radar), letting you monitor numerous meteorological scenarios, including severe weather, more closely. 6.4.1 Using Network America 1. Open NetRad to display the NetRad interface. 2. Select Setup > Main Setup to open the NetRad Setup menu. 3.
FasTrac Millennium User’s Guide – May 2003 Controlling Your Radar 6.5 Comparing Base Reflectivity and Composite Reflectivity Base reflectivity shows the intensities at each of the elevation angles. In the following example, base reflectivity 1-4 shows a small storm event very far off, but undershoots the closer storm. The elevations for the four-base reflectivity NEXRAD products are also depicted.
Controlling Your Radar FasTrac Millennium User’s Guide – May 2003 Composite reflectivity shows the greatest intensity regardless of height in storms. In the following example, the greatest intensities for the storm further from the radar are shown, both aloft and closer to the ground. The composite image also reveals another storm closer to the radar.
FasTrac Millennium User’s Guide – May 2003 6.6 Controlling Your Radar Points to Remember Use the Radar Control panel to control your real-time, non-Baron radar. Use the RADACS Control panel to control your Baron radar. Use the NEXRAD Main panel to control your NEXRAD radar data. Use the Advanced Baron Chart to set color schemes for NEXRAD data. Base reflectivity shows the intensities at each of the elevation angles and should be used to view storms that are far from the radar.
Glossary Anti-Alias – An option that provides a smoothing effect to the pixels used in text. Auto Scan – An option in the StormScan setup menu that automatically updates the status of Storm Cell Information and Tracking (SCIT) indicators when new radar data is available. azimuth – The angle of horizontal deviation, measured clockwise in degrees, from one point on a map to another. base view – A saved view that acts as a starting point for a zoom, pan, or time-lapse operation.
Glossary FasTrac Millennium User’s Guide – May 2003 FutureScan – This is an optional module that predicts and displays the intensity and location changes of precipitation fields. High Definition Data Processing (HDDP) – This feature smoothes out the pixelated appearance of NEXRAD radar data. hot buttons – A set of 20 buttons, directly above the view area, that lets you execute various features with a single left click. Some hot buttons also have right-click features.
FasTrac Millennium User’s Guide - May 2003 Glossary pan – Changing the center point of a view. Previous – The View Main panel command that lets you switch back to the preceding view. product – Radar data that is intended to depict a certain type of weather (such as Reflectivity for rain). radius – The distance, measured in miles, from the center point of a view to the top or bottom edge. radar levels – Divisions in the color scheme of a radar product that indicate the severity of that product.
Glossary FasTrac Millennium User’s Guide – May 2003 storm track – The projection of a storm’s direction and speed; normally used to calculate when a storm will hit certain places. Storm Track Estimated Time of Arrival (ETA) – The clock time that a storm will hit a place, based on the storm’s location, speed, and movement. Street Spotter – The feature used to label important streets and landmarks.
Product Glossary In this Product Glossary, B denotes Baron-generated products, while N denotes non-Barongenerated products. All product numbers (for example, 4E) are in hexadecimal code. Italicized words are terms that are defined elsewhere in this glossary. Base and Convective Storm Products: 1-hour accumulation (4E): Shows the NEXRAD-estimated horizontal distribution of precipitation over a one-hour time period.
composite shear (25F): Shows the maximum value of shear located in the storm within the first four scanning level. B corrected radial velocity (31B): This product displays the velocity, which is result of correcting the radial velocity for various errors, including second-trip echoes and range folding. This product is also known as corrected base velocity.
storm relative velocity (38): The velocity that is relative to storm movement. This product is the base velocity with the average movement of storms, which are defined by a storm-defining algorithm, being subtracted out. Therefore, the motion appears relative to the storms. Note: Storm relative velocities are only available for the first two scanning elevations of the volume. N storm relative velocity 1K (138): The storm relative velocity converted to a 1 km by 1 km pixel display.
1-hourly (279), 3-hourly (27a), 12-hourly (27b) and 24-hourly (27F) snow rate 1K: These products provide a 5-minute by 5-minute look at snow precipitation accumulations in a 1-hour, 3-hour, 12-hour or 24-hour window. B 1-hourly (270), 3-hourly (271), 12-hourly (272) and 24-hourly (27C) total precipitation rate 1K: These products provide a 5-minute by 5-minute look at total precipitation accumulations in a 1-hour, 3-hour, 12-hour or 24-hour window.
Snow Machine (268): This product enables the ability to display rain, mixed precipitation and snow, as well was their respective rates. The result is a radar display where the first five levels represent liquid precipitation, the next five levels indicate mixed precipitation, and the last five levels depict snow rates. In addition, this module allows the user to see the transition of precipitation type and rate as a system moves across a viewing area.