
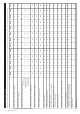
Specifications


31
© Baxi Heating UK 2011
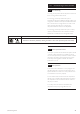
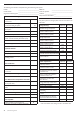
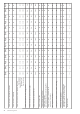
Graphic symbol Description Indication in operation
Indicator values
dT Temperature difference
min Min value Appears when minimum values are indicated
max Max value Appears when maximum values are indicated
5 x 7 segment display. Display of all values, display flashes when
Presentation of figures 00000 to 99999 a value is changed
ºC Temperature in Celsius
K Temperature difference in Kelvin
h Operating hours
kWh Productivity indication in kWh
11.0 Commissioning of solar controller
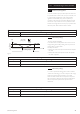
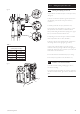
11.8 Overview of display and operating elements
(cont)
Fig. 34