
Technical data


9 Monitoring a WebLogic Server Domain
9-10 Configuring and Managing WebLogic Server
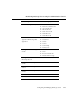
Other Server Monitoring Links
Each top level tab page for a server instance—Performance, Security, JMS, JTA— has
links to display:
! Server Log—The Server Log contains all messages generated by its subsystems
and applications.
! JNDI Tree—The JNDI tree shows the objects deployed to the current server
instance.
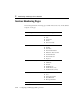
Clusters Monitoring Pages
The following table lists the monitoringpages available for a cluster, and the attributes displayed
on each page
Domain
→Server→Remote Start
Output
→View Node Manager
output...
If the server instance was started by
Node Manager,
the Node Manager log can be viewed
with this link.
Domain
→Server→Monitoring→
JRockit
! Total Nursery Size
! Max Heap Size
! Gc Algorithm
! Total Garbage Collection Count
! GCHandles Compaction
! Concurrent
! Generational
! Incremental
! Parallel
! Number Of Processors
! TotalNumberOfThreads
! Number Of Daemon Threads
Console Page Attributes Displayed