
Instruction manual

DAC2 Series Instruction Manual Rev C Page 40
Performance Graphs
A
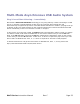
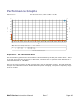
udio Precision FFT Idle Channel Noise, 0 dBr = 0 dBFS = 23 dBu
DAC2 - FFT Idle Channel Noise.at27
ColorSweep Trace Line Style Thick Data Axis Comment
1 1 Green Solid 4 Fft.Ch.1 Ampl Left
1 2 Red Solid 4 Fft.Ch.2 Ampl Right
-160
+0
-140
-120
-100
-80
-60
-40
-20
d
B
r
A
-160
+0
-140
-120
-100
-80
-60
-40
-20
d
B
r
A
0 32k2k 4k 6k 8k 10k 12k 14k 16k 18k 20k 22k 24k 26k 28k 30k
Hz
Graph Plot 1 – FFT Idle Channel Noise
The extraordinary performance of the DAC2 is demonstrated by the FFT plot shown above. There
is no sign of any AC hum, there are no idle tones, and there are no spurious tones detected at a
measurement limit of -160 dBFS.
The rise at 0 Hz is normal in an FFT analysis and is not an indication of noise. This 32k point FFT
analysis uses a Blackman-Harris window with 16x power averaging, and spans a frequency range
of DC to 32 kHz.