
Instruction manual

DAC1 HDR
Instruction Manual Rev I Page 29
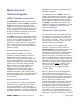
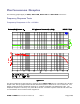
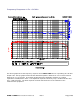
Frequency Response at Fs = 96 kHz
The above graphs show the frequency response of the DAC1 HDR when it is operating at a 96-kHz
sample rate. The top graph shows that the differential phase is better than ± 0.5º at 20 kHz and
better than ± 1º at 43 kHz. The bottom graph shows the amplitude response on a highly
expanded 0.05 dB/division scale. The amplitude response is down by only 0.22 dB at 20 kHz and
only –1 dB at 43 kHz. The bass response extends well below the 10-Hz limitation of the
measurement equipment.