
Instruction manual
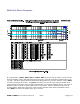

DAC1 HDR
Instruction Manual Rev I Page 37
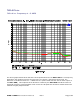
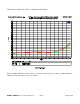
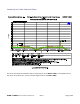
Jitter Tests
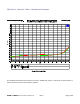
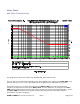
AES Jitter Tolerance Test
The graph above shows the results of a standard AES jitter tolerance test.
The top (red) curve shows the amplitude of the jitter applied to the inputs of the DAC1 HDR. The
scale for the top curve is on the right hand side of the graph and is calibrated in UI of jitter.
The bottom (green) curve shows the THD+N of the DAC1 HDR as the jitter amplitude and
frequency is varied at the inputs of the DAC1 HDR. There is absolutely no change in the DAC1
HDR THD+N measurement over the entire range of jitter test frequencies and amplitudes. In fact,
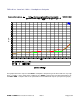
the DAC1 HDR can tolerate much higher levels of jitter without any measurable change in
performance (see the next graph).