
Instruction manual

DAC1 HDR
Instruction Manual Rev I Page 38
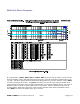
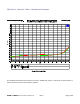
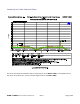
THD+N vs. Jitter Amplitude and Jitter Frequency
The above graph shows the results from the most severe jitter test that we could create with an
Audio Precision System 2 Cascade test set. We selected a 10-kHz audio test tone in order to
maximize the sensitivity of the test. We set the interface jitter amplitude to its maximum value of
12.75 UI (2075 ns) of jitter. We then swept the jitter frequency from 2 Hz to 9 kHz and plotted the
THD+N from the DAC1. Absolutely no change in THD+N was observed at any test frequency, and
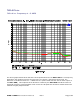
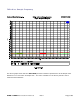
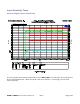
the DAC1 performance did not change when the jitter was turned off. The same test was
conducted using FFT analysis to look for jitter-induced artifacts. No change was observed on a FFT
analysis (see the next graph).