GLYCO DOC GEL IMAGING SYSTEM INSTRUCTION MANUAL Catalog Numbers 170-6555 170-6556 170-6557 170-6558 170-6559
Table of Contents TABLE OF CONTENTS Safety Section 1.0 Installation and Startup ...............................................................................................1 1.1 Unpacking.......................................................................................................................2 1.2 Set-up the Computer and Imager...................................................................................2 1.2.1 Installing the Camera Circuit Board in a Computer..........................
Table of Contents Figures 1. Glyco Doc Imaging System ............................................................................................................1 2. Installing the Camera Board in the Computer ................................................................................3 3. Glyco Doc Imaging System Cable Connections ............................................................................4 4. Imager Power and Filter Indicators ........................................................
Safety SAFETY ! Warning Disconnect the Glyco Doc Imager before servicing. Refer servicing to Bio-Rad service personnel. This Glyco Doc Imager is certified to meet the I.E.C. 1010* safety standard. Certified products are safe to use when operated in accordance with the instruction manual. This safety certification does not extend to other equipment or accessories not I.E.C. 1010 certified, even when connected to this Glyco Doc Imager. This instrument should not be modified or altered in any way.
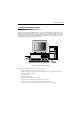
Installation and Startup 1.0 INSTALLATION AND STARTUP The Glyco Doc Imaging System simplifies analysis of small format carbohydrate electrophoresis gels. Its primary components are the Imager, the Glyco Doc analytical software, and a host computer. The Imager is suitable for both fluorescent and visible dye applications.
Installation and Startup 1.1 UNPACKING Carefully inspect the shipping cartons for any damage which may have occurred in shipping. Severe damage to a carton may indicate damage to its contents. If you suspect damage to the contents may have occurred, immediately file a claim with the carrier in accordance with their instructions before contacting BioRad Laboratories. Open each of the shipping cartons and lift each component out of its packing. Check the contents against the supplied packing list.
Installation and Startup To install the camera board, follow the procedure below. 1. Turn off your computer and unplug the power cord. This procedure assumes the computer was previously set up and used for other applications. 2. Turn off all connected peripheral devices. Connected devices include printers, monitors, etc. 3. Remove the cover from your computer. Refer to the documentation supplied with your computer system. 4. Discharge static electricity.
Installation and Startup 7. Place the Camera board in the slot The connector on the Camera board must face the back of the computer. Insert the board, pressing firmly so that it slips into place. 8. Re-mount the screw removed in Step 6. This screw will hold the board in place. 9. Re-mount the computer cover and its screws. Proceed to section 1.2.2, Setting up the System. 1.2.2 Setting Up the System To set up the computer, you will need to make the connections shown below.
Installation and Startup To set-up the Imager, you need a Phillips head screw driver. Refer to Figure 4. 1. Locate the Filter Lock Screw on the bottom of the Imager and turn it counter clockwise, two complete turns. The Filter Lock Screw is encircled by an orange marker on the bottom of the Imager. The Filter is locked in place for shipping. 2. Test to see that the filter is now free by twisting the Filter Switch. The Filter Switch is the black plastic knob on the back of the Imager.
Installation and Startup 1.2.3 Installing the Glyco Doc Software Note If your purchase included a computer, proceed to section 1.3. Your computer was shipped with the Glyco Doc software installed. To install the Glyco Doc software, you need the following items: • 1 Glyco Doc setup disk • 1 Glyco Doc image disk To install the Glyco Doc software, follow the procedure below. 1. Insert the Glyco Doc Setup disk into an available floppy drive.
Installation and Startup 1.3 VERIFY SYSTEM OPERATION This section provides a general description of the use of the Glyco Doc system. 1.3.1 Starting the Glyco Doc Software When you power-up the computer, monitor, and Imager, a series of self-test and configuration status messages is displayed, followed by the C:\>, which is the indication that the system is ready. Start the Windows 3.1 interface software (by typing win), and then double click on the Glyco Doc icon to launch the Glyco Doc application.
Installation and Startup 1.3.2 Acquire an Image using the Test Plate To verify system operation, start by acquiring an image of the Test Plate. Note If you did not purchase a computer with the Glyco Doc system: Before doing any imaging, you must first create a Bright Field file. Refer to the chapter on Maintenance for discussion of the purpose of the Bright Field and the process for creating a Bright Field file IMAGE AREA SETUP PATTERN SE-1085 Place cassette with the long plate down. Figure 6.
Installation and Startup To acquire an image using the text plate, follow the procedure below. 1. Turn on the Imager and set the Filter Switch to 500 nm. The Power On/Off and Filter Switches are located on the rear of the Imager. The Filter Switch should be set to Carbohydrate, which uses a 500 nm filter. The LEDs on the front of the Imager indicate Power ON and the Filter setting. 2. If you have not already done so, start the Glyco Doc software. Double-click on the Glyco Doc icon to start the software. 3.
Installation and Startup 1.4 IMAGE ANALYSIS USING THE IMAGE PROVIDED WITH YOUR SYSTEM The key steps to analyzing an image are: • Open the image file (Use the image file demo1.RAW) • Adjust the image display • Find bands • Perform a standard lane analysis • Save the data file To analyze the sample image provided with your system, follow the procedure below. 1. Open an image file. a. Select the Open command from the Files menu. b. From the Open File dialog box, select the image file demo1.
Installation and Startup Files Image 1 2 Bands 3 Options 4 5 Bio-Rad Glyco Doc Analytical Software Window Help 6 7 Mouse x=200 y=3 Grey=5451 Zoom Image Histogram Quan 0AutoScale Range: 5376 to 18175 Contrast Brightness Figure 7. Image Display, Control, and Status Windows 5. Selectively insert and mark a band or remove a marker from a band of no interest: • To remove a band’s marker, click on the + marker and select Delete in the Bands menu.
Installation and Startup 7. Analyze band data as presented in the Band Tables. The following tables are available: Band Location Description Band Location | Total Gray Rf Total Gray Degree of Polymerization Peak Gray Base Pairs Percent Luminance of Selected Bands Molecular Weight Quantity 8. Perform other band analysis operations as desired. Each row in a band table displays bands which the software has determined are associated based on their location in the image (as measured in Y-axis pixel counts).
Installation and Startup 1.5 PREPARING FOR GEL IMAGING This section discusses the preparation of gels prior to imaging. The table below provides some examples of how gels must be prepared before they are placed in the Imager tray. Table 1.
Installation and Startup 1.6 EXAMPLE OF A STANDARD LANE ANALYSIS In the oligosaccharide sample image (demo1.raw) provided with your Glyco Doc system, there must be at least nine Band Markers in the oligosaccharide standard lane or the analysis will fail and the error dialog box is displayed. (More than nine markers may be present, as there are more than nine bands in the glucose ladder standard.) Standard bands G4 through G12 must have Band Markers.
Software Reference 2.0 SOFTWARE REFERENCE This chapter discusses each of the software functions. The chapter is organized according to the software’s menu structure. 2.1 FILES MENU Each of the Files drop down menu’s selections is discussed below. Open... Displays the Open File window, which lists all the files available to Glyco Doc and their location on the computer’s hard disk. Close Closes the currently loaded file.
Software Reference Densitometer Reports A printout is generated for each lane, with the Densitometer positioned next to its corresponding lane. All quantitative and migration data for that lane is included. The Densitometer report can be scaled in two ways: - Normalized to each Lane - This report scales the densitometer output so that the brightest peak in each lane corresponds to the top of the densitometer scale for that lane’s output.
Software Reference Image File To export an image from Glyco Doc, so that it can be incorporated into a report or document created in a different application. In the Save As window that is displayed, 1. Use the File Name field to change the displayed filename’s extension to .RAW, which is required of all Image files. 2. From the list of Image files that is displayed, select the file you want to save. 3. From the Save File as Type field, select the file type supported by your software application.
Software Reference 2.2 IMAGE MENU To obtain the best image from which both image and band data files are derived, the Image menu offers a number of setup controls and options. Acquire This selection initiates image acquisition. It requires you to specify the type of gel to be imaged: Carbohydrate, DNA, or Protein, before bringing up the SE1000 Camera Control window. SE 1000 Camera Control Acquire using Percent Saturation... 0.00 (between 0.0 and 5.0) Exposure time... 1.00 (0.1 secs to 10.
Software Reference The Exposure Time is influenced by how intensely the fluorophore is emitting light. This, in turn, is proportional to the concentration of the substance containing the fluorophore in the gel; greater intensity means shorter exposure. The Exposure time... setting should prevent overexposure of bands of interest; saturation is acceptable only if it is indicated for bands that will not be quantized. To see the results of overexposure, select HiLite Saturated Pixels from the Options menu.
Software Reference Acquire Options These selections must be made before you acquire the image. Select Image Rectangle After you acquire the first image of a gel, you may be able to improve the quality of subsequent images by drawing an Image Rectangle over your area of interest. (The sensitivity of the camera becomes greater as you reduce the extremes of intensity in the imaging area.) To mark a region using the Image Rectangle, 1. Place the cursor where you want the first corner of the Image Rectangle.
Software Reference 2.3 BANDS MENU Glyco Doc identifies bands by looking for sudden drop-offs in intensity. Glyco Doc then groups bands according to the following definitions: • Lane: Glyco Doc defines a Lane as all bands in the same column. • Row: Glyco Doc assigns a Row Association to all bands appearing at approximately the same distance from the top of the image. Glyco Doc also allows you to insert a band not automatically located by the software and to change a band’s row association.
Software Reference Insert Band This selection allows you to insert a band which may otherwise have been overlooked by the automatic band marking function. Selecting Insert Band causes the Outline cursor to be displayed. By pressing the left mouse button and dragging, you draw the band’s outline. When you release the left mouse button, the band’s marker appears and the band data is included in the band tables. Delete The three choices under this selection delete band data from the band tables.
Software Reference Set Quantitive Standard Band... This allows you to select a band other than the standard. Display Standard Plot on Log Scale This allows you to plot Size versus Rf for Protein and DNA gels. Band Information This is the data available for analysis and displayed in the band tables. (For a complete discussion of the Band Tables, refer to that section later in this chapter.) To display a band’s information, double click on its marker, or click once and select Band Information....
Software Reference 2.4 OPTIONS MENU The Options menu provides a number of display selection, each of which is discussed below. Reverse Palette When selected, the displayed image is reversed, so that a negative image becomes positive and a positive image becomes negative. HiLite Saturated Pixels When selected, saturated pixels are displayed in yellow. Autoscale every image update When this is selected, the software automatically sets the Contrast and Brightness for the entire image or Image Rectangle.
Software Reference 2.5 WINDOW MENU This menu allows you to specify what type of data you want to display. Band Table A band table is a resizable and scrollable window displaying data about each marked band. This selection is a toggle function for hiding or displaying band tables. The different band tables are available by clicking on the word “Mode” in any displayed band table. Note the following: • This is selected from the upper left corner of any band table. It is not a menu bar item.
Software Reference Rf Rf (Relative mobility) are determined by setting the center point of one band to have an Rf = 1 and that of another band to have an Rf = 0. All bands between those two points are given a value between 1 and 0 based on a linear scale. Bands above Rf = 0 are given a negative value and those below Rf = 1 are given a value greater than 1. These numbers are based on the same scale as the numbers in the 0 to 1 range. For oligosaccharides, the Rf = 1 band is G4 and the Rf = 0 band is G12.
Software Reference Show Selected Lanes This mode displays the intensity levels within a lane or compares between two or more lanes. Include the first lane by clicking on the number found at the top of the lane. Include additional lanes by holding down the key and clicking on each additional lane number. Each lane will have its fluorescent intensity plotted in the graph.
Theory of Operation 3.0 THEORY OF OPERATIONS During exposure, the Imager’s CCD (Charge Coupled Device) detector collects photons emitted by the fluorophore in a prepared gel. The detector is a semiconductor grid of approximately 180,000 cells for collecting these photons. Each cell in the grid can collect up to 65,535 charge units per exposure.
Maintenance and Troubleshooting 4.0 MAINTENANCE AND TROUBLESHOOTING In this chapter, the following Imager hardware maintenance procedures are given: • Replacing the UV Light • Cleaning the Excitation Filter • Creating a New bright field A trouble-shooting chart for the Imager is provided in Section 4.5. For trouble-shooting computer problems, consult the appropriate computer vendor’s documentation. For difficulties with memory storage limitations, see Section 4.6.
Maintenance and Troubleshooting 8. Perform the previous steps in reverse to install the new tube and close-up the Imager. 9. Create a new Bright Field file. Refer to Section 4.4. EXCITATION FILTER EMISSION FILTER Figure 10.
Maintenance and Troubleshooting 4.2 CLEANING THE EXCITATION FILTER The Excitation Filter is located immediately above the gel holder and just below the UV lamp. It is a glass square approximately 3.75” and is a metallic brown color. Follow the procedure below to replace the Excitation Filter. Note Wear lint and powder free gloves while holding the filter. 1. Turn off the Computer and the Imager. 2. Unplug the power cord from the back of the Imager and disconnect the Imager Interface Cable. 3.
Maintenance and Troubleshooting 4.3 PREPARING GEL PLATES The gel plates should be free of smudges, blotches, or any film on both sides. Clean off any pieces of acrylamide, fingerprints or lint which will appear as artifacts in the image. If the glass needs to be cleaned, we recommend using Kimwipes EX-L Lens Cleaning Station, sold as Kimwipes No. 34662, consisting of two boxes of Kimwipes EX-L delicate Task Wipers and 1 bottle of Kimwipes EX-L Lens Cleaning Solution.
Maintenance and Troubleshooting 2. From the Image menu’s Acquire Options, select Make New Bright Field File. Follow the on-screen instructions, directing you to insert the Bright Field Plate. After the Bright field image is acquired, remove the plate. 3. Save the Bright Field file. After selecting OK at the prompt to save, the file is stored as se1000.brt. The Bright Field file is stored in the directory specified by the line shown below, written in the glyco.
Maintenance and Troubleshooting 4.5 IMAGER TROUBLESHOOTING Try all appropriate actions in the chart below for the imaging problem you are experiencing, before calling a Bio-Rad technical representative (Appendix D). Table 3 Imager Troubleshooting Indication Image is solid black in normal palette and the acquire time is approximately 4 seconds. Problem Action Imager is turned off. Turn on imager. UV light has burned out. Replace UV light.
Maintenance and Troubleshooting Table 3 (continued) Imager Troubleshooting Indication Problem Action Too little or too much of the gel is being acquired. Incorrect Image Rectangle. Reselect the Image Rectangle using the Select Image Rectangle command in the Image menu’s Acquire Options. Unable to acquire one side of the gel. When selecting the Image Rectangle, that side of the gel is also not visible. Mirror is out of position. Call for service. Acquired image is unusually blurry.
Initialization File APPENDIX A. INITIALIZATION FILE The GLYCODOC.INI initialization file defines the default options an application automatically selects when it is first envoked. Because it is a text file, it can be easily edited by the user.
Initialization File A.3 COLORS Colors are designated by their Red, Green, and Blue contents.
Initialization File A.4 BAND DESCRIPTIONS The value set in the Band Associations Dialog Box is the band association pixel distance. It determines whether or not two bands are associated. • BandLinkOverlap=6 Band description settings are used by the Band Descriptions pulldown item.
Initialization File [Monosaccharides] • KeyBand=GlcNAc • RF0Band=GlcNAc • RF1Band=GalNAc • BandNames=GlcNAc 50.00,Galactose 50.00,Glucose 50.00,Fucose 50.00,Mannose 50.00,GalNAc 50.00 [Oligosaccharides] • KeyBand=G4 • RF0Band=G12 • RF1Band=G4 • DP=4 • Quantity=50.0 • QuantBand=G4 • BandNames=G2,G3,G4,G5,G6,G7,G8,G9,G10,G11,G12,G13,G14 [Lane Descriptions] • Monosaccharides= • Oligosaccharides= • StandardsNames=Monosaccharides,Oligosaccharides A.
Imager Specifications APPENDIX B. IMAGER SPECIFICATIONS Imaging Type: Fluorescence, Transmittance Detector Type: CCD array, 753 x 244 pixels Light Source: UV lamp filtered for maximum output at 368 nm Imaging Resolution: Vertical resolution of 320 µm Excitation: Wavelength maximum output at 368 nm Imaging Area: 10 x 10 cm cassette holder, 8 x 8 cm imaging area Imager Dimensions: 12.
Warranty and Ordering Information APPENDIX C. WARRANTY AND ORDERING INFORMATION The Glyco Doc Imaging System is warranted for 1 year against defects in materials and workmanship. If any defects should occur during this warranty period, Bio-Rad Laboratories will replace the defective parts without charge. However, the following defects are specifically excluded: 1. 2. 3. 4. 5. 6. Defects caused by improper operation.
Warranty and Ordering Information WARRANTY INFORMATION Model: ______________________________________________________________________ Serial Number:________________________________________________________________ Date of Delivery: ______________________________________________________________ Warranty Period: ______________________________________________________________ ORDERING INFORMATION Prices and part numbers are subject to change. Call for current prices.
?O2@6K ?O2@6K? O2@6K? O2@6K? O2@6K? O2@6K? O2@6K? O2@6K? O2@6K? O2@6K? O2@6K? O2@6K? O2@6K? O2@6K? O2@6K? O2@6K? O2@6K? O2@6K? O2@6K? O2 @@@@@6K? O2@@@@@@@@@6K? O2@@@@@@@@@6K? O2@@@@@@@@@6K? O2@@@@@@@@@6K? O2@@@@@@@@@6K? O2@@@@@@@@@6K? O2@@@@@@@@@6K? O2@@@@@@@@@6K? O2@@@@@@@@@6K? O2@@@@@@@@@6K? O2@@@@@@@@@6K? O2@@@@@@@@@6K? O2@@@@@@@@@6K? O2@@@@@@@@@6K? O2@@@@@@@@@6K? O2@@@@@@@@@6K? O2@@@@@@@@@6K? O2@@@@ ?O2@@@@@@@@@6K ?O2@@@@ ?I4@@@@@@6K? O2@@@@@@0M?I4@@@@@@6K? O2@@@@@@0M?I4@@@@@@6K? O2@@@@@@0M?I4@@@@@@6K?
Bio-Rad Laboratories, Inc. Life Science Group 2000 Alfred Nobel Drive Hercules, California 94547 Phone: (510) 741-1000 Fax: (510) 741-1060 Bio-Rad Laboratories Main Office, 2000 Alfred Nobel Drive, Hercules, California 94547, Ph. (510) 741-1000, Fx. (510) 741-5800 Also in: Reagents Park, Australia, Ph. 02-9914-2800, Fx. 02-9914-2888 Wien, Austria, Ph. (1) 877 89 01, Fx. (1) 876 56 29 Nazareth, Belgium, Ph. 09-385 55 11, Fx. 09-385 65 54 Mississauga, Canada, Ph. (905) 712-2771, Fx.