
Software Owner's manual


17
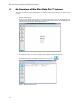
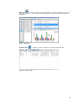
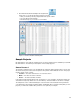
5. Notice the “Compare by” and Control drop-down lists.
Compare by — changes how samples are grouped on the x-axis of the graphs and grouped for
analysis in the summary table.
Control — chooses the biological replicate group for your experiment. This group is plotted on the
left side of the graphs and results in the P-value for the pair-wise statistical tests being presented
in the relevant views.
Figure 13. Compare by and Control drop-down lists
Compare by
and
Control
drop-down
lists