Bio-Plex Data Pro™ Software User Guide Version 1.
Bio-Plex Data Pro Software User Guide | BIO-RAD TECHNICAL SUPPORT DEPARTMENT The Bio-Rad Technical Support Department in the U.S. is open Monday through Friday, 5:00 a.m. to 5:00 p.m., Pacific Standard Time. Worldwide technical support is available on the Web at www.consult.bio-rad.com. Phone: 1-800-424-6723, option 2 Fax: 1-510-741-5802 Email: LSG.TechServ.US@Bio-Rad.com (U.S.) LSG.TechServ.Intl@Bio-Rad.com (International) Web: www.consult.bio-rad.
Bio-Plex Data Pro Software User Guide Table of Contents Chapter 1. Introduction . . . . . . . . . . . . . . . . . . . . . . . . . . . . . . . . 1 Basic Workflow . . . . . . . . . . . . . . . . . . . . . . . . . . . . . . . . . . . . . . . . . . . . . . . . . . The Workspace . . . . . . . . . . . . . . . . . . . . . . . . . . . . . . . . . . . . . . . . . . . . . . . . . . Toolbar Commands . . . . . . . . . . . . . . . . . . . . . . . . . . . . . . . . . . . . . . . . Overflow Toolbar Commands . . . . . . .
Bio-Plex Data Pro Software User Guide | Table of Contents Removing Filters. . . . . . . . . . . . . . . . . . . . . . . . . . . . . . . . . . . . . . . . . . Adding a Column. . . . . . . . . . . . . . . . . . . . . . . . . . . . . . . . . . . . . . . . . . . . . . . . Hiding a Column . . . . . . . . . . . . . . . . . . . . . . . . . . . . . . . . . . . . . . . . . . . . . . . . Sorting Data . . . . . . . . . . . . . . . . . . . . . . . . . . . . . . . . . . . . . . . . . . . . . . . . . . .
Bio-Plex Data Pro Software User Guide 1 Introduction Bio-Plex Data Pro™ software provides tools for annotating and analyzing the results of experiments conducted in Bio-Plex Manager™ software. When you import Bio-Plex Manager data into Bio-Plex Data Pro, you can edit samples, view results, and perform statistical analysis on data. These actions take place within a Bio-Plex Data Pro project. Basic Workflow The basic workflow in Bio-Plex Data Pro consists of the following steps: 1. Create a project. 2.
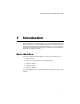
Bio-Plex Data Pro Software User Guide | The Workspace The Workspace The Bio-Plex Data Pro software Home view displays buttons to create a new project or to open an existing project. You can also open a recent project by clicking the project name in the Recent Projects list. The left pane displays the project workflow, starting at the top with Manage Data Sets and ending with Perform Analysis/Create Charts.
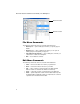
The Workspace Import Bio-Plex Results File Undo Redo Select Sample Type for analysis Clear All Analysis Filters Reset Sample Lists to Default Sort Merge samples run on different panels/assays Undo Merge Samples Overflow Toolbar Commands Clicking the triangle displays an overflow toolbar of hidden commands. Overflow toolbars are enabled whenever the screen size does not allow all toolbar commands to be displayed.
Bio-Plex Data Pro Software User Guide | The Workspace Overflow toolbar Overflow toolbar File Menu Commands The following commands can be accessed from the File menu: • New Project — opens a dialog box in which you specify project details • Open Project — opens a dialog box in which you can open an existing project and organize your projects • Import Bio-Plex Results File — opens a dialog box, in which you can browse to a data set and import it • Exit — closes Data Pro software Edit Menu Commands The fol
The Workspace • Customize Sample Table — opens a dialog box in which you can select or clear columns or add new columns to the sample table. • Customize Result Table — opens a dialog box in which you can hide or display columns, add new columns, and reorder columns. • Copy Table to Clipboard — copies the entire table to the clipboard, including the column titles. Copy Table to Clipboard Full Precision — copies the data with full precision to the clipboard.
Bio-Plex Data Pro Software User Guide | The Workspace Copy Table to Clipboard Right-click the table and select Copy Table to Clipboard on the context menu to copy the entire table to the clipboard, including the column titles. CTRL+C Copies the contents of selected cells to the clipboard. Delete Deletes the content of selected cells if they are not read-only. CTRL+X Copies contents of selected cells to the clipboard and deletes content of selected cells that are not read-only.
The Workspace View Menu Commands From the View menu you can access the following: • Imported data sets in the Data Set Table • Individual sample data in the Sample Table • Results in the Results Table (Single Analyte), Multi Analyte Table, and Heat Map • Analyze data in Scatter Plot, Box and Whisker Plot, Bar Graph, Summary Table, Export to Statistics Software table, and Results by Sample table 7
Bio-Plex Data Pro Software User Guide | The Workspace 8
Bio-Plex Data Pro Software User Guide 2 Working with Projects A project is the container for your data. After you create your project, you import data into the project. You can have as many projects as you like. Creating a Project Follow the procedure for creating a new project. To create a project: 1. From the Home view, click New Project. The New Project dialog box appears. Note: You can also create a new project by selecting New Project from the File menu or clicking New Project in the toolbar. 2.
Bio-Plex Data Pro Software User Guide | Creating a Project 3. Type the name of the project owner in the Owner box. 4. (Optional) Type the name of the team. 5. (Optional) Type the name of the supervisor. 6. (Optional) Type a description for the project (up to 255 characters). 7. Click OK. The Import Bio-Plex Results File dialog box appears. Note: The name of the project appears in the Import Into list. 8. Click Browse and navigate to the data sets you want to import. 9.
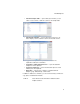
Opening a Project The following information is displayed for each data set: Name — displays the name of the data set; by default this is the name of the imported Bio-Plex Results file (.rbx file). User Name — displays the name associated with the data set as specified in the general information page of Bio-Plex Manager. Acquisition Time — displays the date and time the data were collected on the Bio-Plex instrument. Description — displays the data file description entered in the Bio-Plex Manager RBX file.
Bio-Plex Data Pro Software User Guide | Opening a Project 2. In the Open Project dialog box, click on the project name. If the project contains data, the project is opened in the Manage Data Sets view. It displays all the data sets contained in the project. See Importing Data Sets on page 15 for more information about data sets. If the project does not contain data, the Import Bio-Plex Results File dialog box appears. See Importing Data Sets on page 15 for information on importing data into your project.
Editing a Project Editing a Project You can edit project attributes in the Edit project dialog box. To edit a project: 1. Click Open Project. The Open Project dialog box appears, displaying a list of projects. 2. Right-click in the row of the project you want to edit, and click Edit Data Set. TIP: Do not click the project name; this will open the project. The Edit project dialog box appears. 3. Edit the project settings and click OK.
Bio-Plex Data Pro Software User Guide | Organizing Your Projects Organizing Your Projects Over the course of time, you will create multiple projects, and you may not be working with all of them at the same time. You can organize your projects by removing projects that you are not currently working on from the list of active projects and moving them to the Inactive Projects list.
Bio-Plex Data Pro Software User Guide 3 Working With Data Sets Bio-Plex Manager™ software results files are imported into Bio-Plex Data Pro™ software for analysis. You can view the data set in the Manage Data Sets view. You can also edit the properties of the data set and delete data sets if you no longer need them for your analysis. Importing Data Sets Data are imported into projects from the Import Bio-Plex Results File dialog box.
Bio-Plex Data Pro Software User Guide | Importing Data Sets Importing Data into Bio-Plex Data Pro Software The following procedure describes how to import data into Bio-Plex Data Pro. To import data sets into a project: 1. From Bio-Plex Data Pro, click Import Bio-Plex Results File in the toolbar. The Import Bio-Plex Results File dialog box appears. 2. Select the desired project from the Import Into drop-down list, or create a project by clicking New Project. 3.
Importing Data Sets Ext. Standards — the data were successfully imported. The unknown values were calculated using an external standard curve. Renamed — the data were successfully imported. The name of the file being imported is the same as a file previously imported into the project, but the data are different.
Bio-Plex Data Pro Software User Guide | Editing a Data Set The Data File field displays the file name and indicates the source as Bio-Plex Manager. You may import this data set just as you would any RBX file. You can add more data sets to this list by using the Browse button. You may also return to Bio-Plex Manager to export another data set. For more information on this feature, see the Bio-Plex Manager Software 6.1 User Manual. Editing a Data Set You can edit the name and description of a data set.
Deleting a Data Set A message asks you to confirm that you want to delete the data set. 3. Click Yes. The data sets are deleted from the project.
Bio-Plex Data Pro Software User Guide | Deleting a Data Set 20
Bio-Plex Data Pro Software User Guide 4 Organizing the Data After data sets are imported into Bio-Plex Data Pro™ software, you can manage the data that is used in your analysis. You can add data to your samples with data from your experiments. You can filter your data and include or exclude samples. Finally, data can be copied or exported to other applications for analysis.
Bio-Plex Data Pro Software User Guide | Viewing and Editing Samples Viewing and Editing Samples The Edit Samples/Add Columns view displays a tabular list (Sample table) of all unique samples in a project in the raw form imported from the RBX files. In this view, you add columns to the Sample table, which allows you to define your biological replicate groups and assign other important information such as demographic data, strain, or gender associated with each sample.
The Sample Table The toolbar in the Edit Samples/Add Columns view displays additional icons. Select Sample Type for Analysis — opens a dialog box in which you select the sample types to use in your analysis. These sample types are the standards, controls, blanks, and unknowns imported from Bio-Plex Manager. This selection is a global setting.
Bio-Plex Data Pro Software User Guide | About the Sample and Results Tables About the Sample and Results Tables The Sample and Results tables are synchronized, so changes you make to one table are immediately reflected in the other. For example: • Filtering data from one table filters it from the other. • Sorting data in one table sorts it in the same order in the other. • Adding a column of data in one table adds it to the other.
Filtering Data To filter data: 1. Click the triangle in the column header to open the drop-down menu. In the Filter section, there is a list of the different sample types for that column. 2. Select the checkboxes of the samples you want to include, and clear the checkboxes of the samples you want to exclude.
Bio-Plex Data Pro Software User Guide | Filtering Data Filtering Data in the Perform Analysis/ Create Charts View The filter tool allows you to filter your data in the same way that you filter your data in the Results tables. To filter data in the Perform Analysis/Create Charts view: 1. Click “Filter by” and choose the column you want to use to filter your data. The list of samples is displayed in the Filter section. 2.
Adding a Column Removing Filters To clear filtering: • • To clear filtering on a column, click the button in the column header to display the drop-down list and select Select All. To clear all filters on all columns in the table, click Clear All Analysis Filters. There are two places where you can do this. You will find it in the drop-down list for any column or in the toolbar.
Bio-Plex Data Pro Software User Guide | Hiding a Column To add a column to the Sample table: 1. Click Add Column in the toolbar to open the drop-down list. 2. Select a column from the list or select Other and type a name for the column in the Header box.
Sorting Data To hide a column in the Results table: 1. In the View Results/View Heat Map view, click Customize Result Table in the toolbar. 2. In the Customize Result Table dialog box, clear the Visible checkbox for each column you do not want to display. 3. Click OK. Sorting Data You can sort any number and combination of columns of data in ascending or descending order. You apply a sort to the first column, and the rows of data are resorted based on the order you select.
Bio-Plex Data Pro Software User Guide | Sorting Data Defining a Sort in the Sample or Results Tables Sorted data in the Sample or Results tables persist between sessions. To define a sort in the Sample or Results tables: 1. Click the button in the column header to display a drop-down list. Note: The icon that appears on the button varies depending on whether the data are sorted, filtered, or neither. See Sorting and Filtering Icons on page 33 for a description of the icons.
Sorting Data 2. In the Sorting section, select Ascending or Descending to sort the data in the column. After a sort is applied to a column, an arrow appears in the column either pointed up (ascending sort) or pointed down (descending sort). A black arrow indicates the first sort, also known as the primary sort. All subsequent sorts are indicated with a grey arrow. TIP: You can sort a single column by clicking the column header.
Bio-Plex Data Pro Software User Guide | Sorting Data Clearing Data Sorting To clear sorting on one column: • 32 To clear sorting on the column, click the button in the column header to display the drop-down list, and select None. When you clear sorting on one column, the sorting on any other column is retained. The data will resort based on the remaining sort settings.
Sorting Data To clear sorting on all columns: • To clear sorting on all columns in the table, click Reset to Default Sort in the drop-down list for any column or click the Reset to Default Sort button in the toolbar. SORTING AND FILTERING ICONS For the Sample and Results tables, a button on each column displays a triangle by default. The icons on the button change depending on the combination of sorting and filtering applied on the column. Column is not sorted or filtered. This is the default.
Bio-Plex Data Pro Software User Guide | Copying Data in Tables Basic Sorting in Bio-Plex Data Pro Software This section describes how to sort Bio-Plex Data Pro data if you are not using the sort tool available in the Sample and Results tables. Sorting that is done without the sort tool — that is, basic sorting — does not persist between sessions. The data return to their pre-sorted order.
Viewing Data Values with Full Precision Copying the Data Set Table You can copy the data set table to the clipboard and paste it into another application. Doing so copies the entire table, including the column headings. To copy the data set table to the clipboard: 1. In the data set table, right-click to open the context menu, and then click Copy Table to Clipboard. 2. Paste the table into the application of your choice. Viewing Data Values with Full Precision Values in the data tables are rounded off.
Bio-Plex Data Pro Software User Guide | Exporting Plots and Graphs Exporting Plots and Graphs Plots and graphs can also be exported as Portable Network Graphics (.png), JPEG, bitmap, or TIFF files. These exported files are of higher quality than the ones produced using the copy and paste tools. To export a plot or graph: 1. In the plot or graph, right-click to open the context menu, and then click Export Plot. 2. In the Export Plot dialog box, enter the name of the file. 3.
Bio-Plex Data Pro Software User Guide 5 Viewing the Data There are several different ways you can view your results in Bio-Plex Data Pro™ software. You can look at the results for one analyte at a time. You can view all the analytes at once and compare the results. You can view the results graphically in a heat map. In addition, you can merge multiple rows of data for the same sample to simplify your view of the data.
Bio-Plex Data Pro Software User Guide | Viewing Results Use this table to review the results of the experiment you imported. You can specify how you want to view the results by filtering or by adding custom columns. Columns and the order you select in the Results table persist until you change them. You can also select different analytes and switch from the table to a heat map view. Heat maps help you quickly identify the intensity readings for an analyte.
Viewing Results The normalized ratio, fold expression, or gene expression value calculated in Bio-Plex Manager™ software Coefficient of variation Standard deviation over the mean of a group of replicates Customize Result Table Add Column The Results table displays the following columns by default. You can add columns by clicking Add Column in the toolbar. Sample ID — you can edit this field. Data Set — one source data set; if the sample belongs to multiple data sets, the sample is listed multiple times.
Bio-Plex Data Pro Software User Guide | Merging Data Merging Data Samples may be run several times for one of the following reasons: • Dilution requirements may be very different for different assays. • Bead regions for the assays may overlap. • Assays from different kits cannot be mixed together for other reasons. The outcome of this is that results for a particular sample appear in several data sets. When the data files are imported, the sample is listed multiple times in the Sample and Results tables.
Merging Data To merge results data: 1. In the Results table, choose “Merge samples run on different panels/ assays” in the toolbar. 2. In the Merge Samples Dialog dialog box, select the columns to match and merge samples. Records with matching names in the selected column are merged appropriately. When data are merged, a column is added to the left side of the table (Merge column), and this column is used to sort the table in ascending order.
Bio-Plex Data Pro Software User Guide | Merging Data Viewing Merged Data in the Results Table In the Results table, the Merge column displays the number of rows that have been merged for each group. The lock in the first column indicates that the data in these rows cannot be edited. Merge Column Locked Rows In a merged table, Observed Concentration (Obs Conc) and Concentration of the coefficient of variation (Conc %CV) columns report average values for merged rows.
Merging Data The multiple analyte view shows all the analytes and observed concentration merged values for each analyte. Viewing Merged Data in the Sample Table Merged data in the Sample table are displayed as individual rows. The rows are sorted so that all merged rows are grouped next to each other. You can edit the merged data in the Sample table; for instance, if you mislabeled a sample. The data will be remerged dynamically based on your edits.
Bio-Plex Data Pro Software User Guide | Heat Map Result View Heat Map Result View A heat map is a graphical representation of data that enables you to quickly identify the intensity readings and to find patterns in the data. Each column in the heat map corresponds to an analyte, each row to a sample, and each cell to a data point. The cells are color coded according to their median or midpoint compared to other samples for that analyte.
Heat Map Result View Commands to the left of the heat map control the order of the samples and the labels used in the heat map. The Chart Options menu allows you to change the manner in which the intensities are calculated and displayed. CHART OPTIONS MENU COMMANDS From the Chart Options menu, you can access the following commands: Frame Cells — a toggle that turns on or off contrasting lines framing each cell.
Bio-Plex Data Pro Software User Guide | Heat Map Result View HEAT MAP SETTINGS The pane to the left of the heat map controls the labeling and sorting of the samples. Use the controls to label the heat map and to sort samples LABELING THE HEAT MAP The Sample Label Field drop-down list displays the columns in the Results table. You can label the heat map with the values of one of these columns.
Adding a Column GROUPING DATA IN THE HEAT MAP You can specify how data in the heat map are grouped. You can group your data by any column in the Results table. Note: The “Group by” drop-down list includes all visible predefined and custom columns in the Results table. Hidden columns do not appear in the list. Using the controls to the left of the heat map, you can apply up to three levels of sorting to the heat map data. The primary sort is set using the “Group by” control.
Bio-Plex Data Pro Software User Guide | Adding a Column 48
Bio-Plex Data Pro Software User Guide 6 Viewing the Results and Basic Statistics In the Perform Analysis/Create Charts view, you can view the graphs and tables that present your results in biologically relevant groupings. Proper annotation of your samples is a prerequisite for using this view. At a minimum, the “Compare by” drop-down list should include column headings that contain the biological replicate groups you want to compare and display on the x-axis of your graphs.
Bio-Plex Data Pro Software User Guide | Analysis Workflow Analysis Workflow The statistical analysis workflow comprises the following actions: • Choose the variable for comparison. In order to do this, you must first annotate the data. • (Optional) Choose the biological replicate group that represents a control for your experiment (if one exists) to do pair-wise comparisons between the control and all other groups. • Select the statistical test to apply to the data.
Analysis Workspace • Analyte charts and tables — charts and tables that provide the results to the analysis you have configured using the controls in the analysis configuration pane. Analysis Configuration Pane The area on the left of the Perform Analysis/Create Tables view is called the analysis configuration pane. It has the following controls to filter your data, indicate how data are compared, and specify which statistical test to apply for analysis.
Bio-Plex Data Pro Software User Guide | Interpreting P-Value Statistics Analyte Table The analyte table is the table at the top of this view. It contains a list of all analytes in the selected samples. Each row in the table contains the analyte name and descriptive statistics for the population of samples for this analyte. ANALYTE TABLE TOOLBAR COMMANDS In the main toolbar you can select one of the following measurements for the analyte table.
Interpreting P-Value Statistics The smaller the P-value, the greater the probability that two or more groups of samples have significantly different analyte measurements. Typically, a P-value of less than 0.05 (5%) is considered significant. Note that when a project contains many analytes, some of them may have a low P-value by chance, even if the samples from different groups do not truly differ. Therefore, a low P-value is not itself an indicator of a good separation between sample groups.
Bio-Plex Data Pro Software User Guide | Understanding Fold Change Statistics Understanding Fold Change Statistics Fold change is calculated for each analyte. Samples are grouped by the field specified in the “Compare by” list. The mean is calculated for each of the groups. The fold change is calculated by dividing the highest mean value by the lowest mean value, and then calculating the base 2 logarithm of the result.
Analyte Charts and Tables The following are additional options available on the toolbar: • Analytes — drop-down list of analytes in the data set. • Fill — toggle between displaying the dots in the scatter plot as outlines or filled in. • Point Size — changes the size of the dots in the scatter plot. • Auto — when selected, controls the band width and margin of the scatter plot, bar and whisker plot, and bar graph.
Bio-Plex Data Pro Software User Guide | Analyte Charts and Tables When the Auto checkbox is selected, the plot displays all groups inside the view port and maximizes the use of the view port. When Auto is not selected, the Band Width (the width of the individual sample categories) and the Margin (the width between sample categories) can be adjusted manually. Hovering over either plot displays detailed information about the object under the cursor. Note: Plots display only samples with valid values.
Analyte Charts and Tables When you select the Bar Graph icon, a Legend column appears in the analyte table. Each selected analyte corresponds to a color. These colors match the colors of the bars in the bar graph. You can also display a legend in the analyte charts and tables pane by clicking the Legend checkbox in the toolbar.
Bio-Plex Data Pro Software User Guide | Analyte Charts and Tables Summary Table The Summary Table displays descriptive statistics for each sample group. Each group is displayed as a row in the table. If you select a Control group, you will see the following statistics: • P-Value —the P-value is the result of comparing the selected group with the control. • Fold Change — the fold change is the base 2 logarithm of the ratio between the control group and group being compared.
Analyte Charts and Tables Export to Statistics Software This table displays each group as a column and includes only the sample values. Unlike the Results by Sample table, it includes only samples with valid values. This table makes it possible to copy data to third-party software applications that support this format for sample groups Results by Sample This table displays all the samples for the current analyte in rows.
Bio-Plex Data Pro Software User Guide | Analyte Charts and Tables 60
Bio-Plex Data Pro Software User Guide A Error Messages As you view your results in the Perform Analysis/Create Charts view using different measurements, you may see errors. The following table describes the conditions in Bio-Plex Manager™ that may cause the error.
Bio-Plex Data Pro Software User Guide | Measurement Norm Ratio Ratio Bio-Plex Data Pro™ Error Message Error Condition OOR< OOR< Acquisition Error No data present or not run Not Run No Bio-Plex Manager data for that analyte Acquisition Error No data present or not run Not Run No Bio-Plex Manager data for that analyte a. Not run means the sample is not run for any analytes and any replicates. All measurements are error not set.
Bio-Plex Data Pro Software User Guide Glossary Analyte The substance being measured, identified, quantitated, or otherwise analyzed in an experiment. In the Bio-Plex® system, analytes are molecules that are being quantitated. Attribute Custom field relevant to customer research, entered manually or copied in from another list (Excel, for example). Concentration The amount of substance present in a sample, usually expressed in weight per volume.
Bio-Plex Data Pro Software User Guide | P-value Statistical representation of the chance that the relationship being observed is observed by pure chance. For example, a P-value of 0.01 means that there is a 1% chance that the relationship between the independent variable and the dependent variable established by the model does not actually exist. Plate Assay plate. Bio-Plex assay plates have 96 or 384 wells. The plate contains assay data.
Bio-Plex Data Pro Software User Guide Index Symbols %CV C 39 A Active project definition of 14 Adding columns 27–28 Analysis Configuration pane 50, Analyte detail views 54 Analyte Charts and Tables 51 Analyte table 50, 52 toolbar 52 51 Color Gradient command 45 Column custom, adding 27 hiding 28–29 Compare by 51 Conc %CV column 39 Concentration of the coefficient of variation 42 Control 51 Copying data 34, 39 graphs 35 heat maps 44 plots 35 Creating a project 9–10 B D Bar graph 54, 56 Bio-Plex Mana
Bio-Plex Data Pro Software User Guide | importing, from Bio-Plex Manager 17–18 importing, status of 16 merging 40–43 row, copying 34 rows, combining 40 sorting 29–34 unmerge 41 Data set deleting 18 editing 18 import status 16–17 name, changing 18 Data sets number of, imported 15 Data Sets table 10 copying 35 description of 11 Data Transform command 45 Description column 39 Filtering data 24–26 Frame Cells command 45 Full precision data values viewing 35 G Graphs copying 35 exporting 36 H Heat map 38, 4
Merging data 40–43 Muilti Analyte table filtering data in 24 Multi Analyte table 39 Reset to Default Sort 33 Results by Sample 54 Results table filtering data in 24–25 hiding columns 29 merged data in 42 synchronized with Sample table 24 O Obs Conc 38 Obs Conc column 39 Observed Concentration 42 One-way/ANOVA test 53 P Perform Analysis/Create Charts view filtering data in 26 Plot box and whiskers 55 scatter 55 Plots copying 35 exporting 36 Project creating 9–10 editing 13 name, changing 13 opening a 11–
Bio-Plex Data Pro Software User Guide | Summary table 54 T Toolbar Analyte table 52 Bio-Plex Data Pro 2 Edit Samples/Add Columns view 23 3 Overflow t-test 53 V View Results/View Heat Map view W Well Locations column 39 Workflow Analysis 50 Bio-Plex Data Pro 1, 2 Workspace Analysis 50 Bio-Plex Data Pro 2 68 37
Bio-Rad Laboratories, Inc. Web site www.bio-rad.