
Software User guide

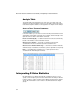
Interpreting P-Value Statistics
53
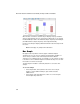
The smaller the P-value, the greater the probability that two or more groups of
samples have significantly different analyte measurements. Typically, a
P-value of less than 0.05 (5%) is considered significant. Note that when a
project contains many analytes, some of them may have a low P-value by
chance, even if the samples from different groups do not truly differ. Therefore,
a low P-value is not itself an indicator of a good separation between sample
groups. Analytes with low P-values may have a large overlap of
concentrations between the sample groups. However, a large P-value is
generally an indicator that significant differences do not exist.
Statistical tests require that two or more groups be identified, and they require
that each group have more than one sample. If the Statistical Test options are
disabled, then your groups do not meet these requirements. Select a different
choice from the “Compare by” drop-down list or edit sample attributes to
identify more than one group with the required minimum number of samples.
If samples are grouped by the “Compare by” column, the P-value column
displays the P-value and the P-value Method column displays the method
used to calculate the P-value.
Bio-Plex Data Pro uses different algorithms to calculate the P-values
depending on the number of sample groups per analyte and the user’s
preference for one test or another. All P-values are two-tailed probabilities.
Bio-Plex Data Pro does not make any assumptions about the direction of
difference between two or more groups.
The following describes which statistical method is used to calculate the
P-value. For data in a normal distribution, select t-test/One-Way ANOVA. The
following logic is used to determine which test to apply:
• If there are two groups, a t-test is applied.
• If there are three or more groups, then the One-Way ANOVA test is
applied.
For data that are not in a normal distribution, or if you are uncertain, select
Mann-Whitney/Kruskal-Wallis. The following logic is used to determine which
test to apply:
• If there are two groups, the Mann-Whitney test is applied.
• If there are three or more groups, then the Kruskall-Wallis test is
applied.
Bio-Plex Data Pro does not assume that data are in a normal distribution and
uses the Mann-Whitney or Kruskal-Wallis test by default.