MiniOpticon™ System Instruction Manual For MiniOpticon real-time PCR detection system with CFX Manager™ software Catalog #CFB-3120
©2012 Bio-Rad Laboratories, Inc. Reproduction in any form, either print or electronic, is prohibited without written permission of Bio-Rad Laboratories, Inc. Adobe, Acrobat, and Reader are trademarks of Adobe Systems Incorporated. Excel, Microsoft, Windows, and Windows Vista are trademarks of Microsoft Corporation. EvaGreen is a trademark of Biotium, Inc. Bio-Rad Laboratories, Inc., is licensed by Biotium, Inc., to sell reagents containing EvaGreen dye for use in real-time PCR, for research purposes only.
Bio-Rad Resources Table 1 lists Bio-Rad resources and how to locate what you need. Table 1. Bio-Rad resources Resource How to Contact Local Bio-Rad Laboratories representatives Find local information and contacts on the Bio-Rad website by selecting your country on the home page (www.bio-rad.com). Find the nearest international office listed on the back of this manual. Technical notes and literature Go to the Bio-Rad website (www.bio-rad.com).
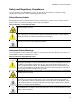
MiniOpticon Instruction Manual Safety and Regulatory Compliance For safe operation of the MiniOpticon system, we strongly recommend that you follow the safety specifications listed in this section and throughout this manual. Safety Warning Labels Warning labels posted on the instrument and in this manual warn you about sources of injury or harm. Refer to Table 3 to review the meaning of each safety warning label. Table 3.
Safe Use Specifications and Compliance Table 5 lists the safe use specifications for the MiniOpticon system. Shielded cables (supplied) must be used with this unit to ensure compliance with the Class A FCC limits. Table 5. Safe Use Specifications Safe Use Requirements Specifications Temperature Indoor use.
MiniOpticon Instruction Manual Although this design of instrument has been tested and found to comply with Part 15, Subpart B of the FCC Rules for a Class A digital device, please note that this compliance is voluntary, for the instrument qualifies as an “Exempted device” under 47 CFR § 15.103(c), in regard to the cited FCC regulations in effect at the time of manufacture.
To prepare and apply the disinfectant, refer to the instructions provided by the product manufacturer. Always rinse the reaction block and reaction block wells several time with water after applying a disinfectant. Thoroughly dry the reaction block and reaction block wells after rinsing with water. WARNING! Do not use abrasive or corrosive detergents or strong alkaline solutions. These agents can scratch surfaces and damage the reaction block, resulting in loss of precise thermal control.
MiniOpticon Instruction Manual Table of Contents Bio-Rad Resources . . . . . . . . . . . . . . . . . . . . . . . . . . . . . . . . . . . . . . . . . . . . . . . . . . ii Writing Conventions Used in this Manual . . . . . . . . . . . . . . . . . . . . . . . . . . . . . . . . . ii Safety and Regulatory Compliance . . . . . . . . . . . . . . . . . . . . . . . . . . . . . . . . . . . . . iii Hazards . . . . . . . . . . . . . . . . . . . . . . . . . . . . . . . . . . . . . . . . . . . . . . . . . . . . . . . . .
Table of Contents Chapter 5. Plates . . . . . . . . . . . . . . . . . . . . . . . . . . . . . . . . . . . . . . . . . . . . . 39 Plate Editor Window . . . . . . . . . . . . . . . . . . . . . . . . . . . . . . . . . . . . . . . . . . . . . . . Setup Wizard . . . . . . . . . . . . . . . . . . . . . . . . . . . . . . . . . . . . . . . . . . . . . . . . . . . . . Select Fluorophores Window. . . . . . . . . . . . . . . . . . . . . . . . . . . . . . . . . . . . . . . . . Well Loading Controls . . . . . . . . . .
MiniOption Instruction Manual Chapter 9. Users and Preferences . . . . . . . . . . . . . . . . . . . . . . . . . . . . . . 113 Log in or Select User . . . . . . . . . . . . . . . . . . . . . . . . . . . . . . . . . . . . . . . . . . . . . . User Preferences Window . . . . . . . . . . . . . . . . . . . . . . . . . . . . . . . . . . . . . . . . . . Files Tab . . . . . . . . . . . . . . . . . . . . . . . . . . . . . . . . . . . . . . . . . . . . . . . . . . . . . . . Protocol Tab . . . . . . . . . . . . . . .
Table of Contents x
MiniOpticon Instruction Manual 1 System Installation Read this chapter for information about setting up the MiniOpticon™ real-time PCR detection system: • System overview (page 1) • System requirements (page 3) • Setting up the system (page 4) • Installing CFX Manager™ software (page 4) • Running experiments (page 8) System Overview The MiniOpticon system uses an array of 48 light-emitting diodes (LEDs) to sequentially illuminate each of the 48 wells in the cycler block.
System Installation • MJ Mini™ thermal cycler base. The MiniOpticon system includes a thermal cycler block that rapidly heats and cools samples. Figure 1. Front view of the MiniOpticon system. When open, the MiniOpticon system includes these features: • Inner lid with heater plate. The heater lid maintains temperature on the top of the reaction vessel to prevent sample evaporation. Avoid touching or otherwise contaminating the heater plate.
MiniOpticon Instruction Manual • USB connections. Use these ports to connect the MiniOpticon system to a computer Figure 2. Back panel of MiniOpticon System. WARNING! Avoid contact with the back panel during operation. System Requirements To operate the MiniOpticon system, use the following power sources and cables: • Input power. 100—240 VAC, 50—60 Hz • Indoor use. Ambient temperature of 15—31oC. Relative humidity maximum of 80% (non-condensing) • Air Supply.
System Installation Setting Up the system The MiniOpticon system should be installed on a clean, dry, level surface with sufficient cool airflow to provide adequate air supply to run properly. The MiniOpticon system requires a location with power outlets to accommodate the MiniOpticon system and the computer. NOTE: Only one MiniOpticon system should be connected to a computer at one time. Installing the MiniOpticon System To install the MiniOpticon system: 1.
MiniOpticon Instruction Manual Table 6. Computer requirements for CFX Manager software. (continued) System Minimum Recommended USB USB 2.0 Hi-Speed port USB 2.0 Hi-Speed port WARNING! Running a MiniOpticon system with CFX Manager software on a PC computer with a Windows 64-bit operating system is not supported due to incompatible USB drivers. A PC computer with a 64-bit processor (like Intel) on a 32-bit Windows operating system is supported.
System Installation 6. If the launch page does not appear automatically, double-click on (CD drive):\Bio-Rad CFX, then open and follow instructions in the Readme.txt file. NOTE: For Windows Vista operating system, you will be prompted to install device software for Jungo during the CFX Manager software installation. Click Install to proceed. If prompted with the warning “Windows can’t verify the publisher of this driver software,” Click Install this driver software anyway to proceed.
MiniOpticon Instruction Manual 5. Select Install the software automatically to install the Bio-Rad Thermal Cycler (EEPROM Empty) driver. Click Next (Figure 5). Figure 5. Software (Driver) installation screen. 6. A window will appear indicating the driver being installed has not passed Windows Logo testing to verify its compatibility with Windows XP. Click Continue Anyway to proceed. 7. Click Finish (Figure 6) at the software installation completion screen when the driver is installed. Figure 6.
System Installation Running Experiments Be sure that the MiniOpticon system is connected to the computer and turned on before launching the CFX Manager software. The green protocol-indicator light on the front of the MiniOpticon detector is illuminated only during a protocol run. WARNING! Remove the shipping plate from the thermal cycler block to operate. Loading the Block 1. To access the MiniOpticon system’s block, turn the front green handle counter-clockwise until it snaps into the open position.
MiniOpticon Instruction Manual 2 CFX Manager™ Software Read this chapter for information about getting started with CFX Manager software. • Main software window (page 9) • Startup Wizard (page 12) • Detected Instruments Pane (page 13) • Status Bar (page 13) • Instrument Properties window (page 14) • Master Mix Calculator (page 15) • Scheduler (page 16) Main Software Window Features available in the main software window are provided in Figure 7. Figure 7. The main software window.
CFX Manager™ Software Menu Bar The menu bar of the main software window provides the items listed in Table 7. Table 7. Menu bar items in the main software window Menu Item Command Function File New Open Create a new protocol, plate, run, or Gene Study. Open existing files, including protocol (.prcl), plate (.pltd), data (.pcrd), Gene Study (.mgxd), and stand-alone run files (.zpcr). View a list of the ten most recently viewed data files, and select one to open in Data Analysis.
MiniOpticon Instruction Manual Table 7. Menu bar items in the main software window (continued) Menu Item Command Tools Scheduler Windows Help Function Open the Scheduler to make reservations for instrument use. Master Mix Calculator Open the Master Mix Preparation calculator. Protocol AutoWriter Open the Protocol AutoWriter window to create a new protocol. Ta Calculator Open the Ta Calculator window to calculate the annealing temperature of primers.
CFX Manager™ Software Table 8. Toolbar buttons in the main software window. (continued) Button Button Name Function Scheduler Open the Scheduler to reserve a PCR instrument. Master Mix Calculator Open the Master Mix Calculator window to set up reaction mixes. User-defined Run Setup Open the Run Setup window to set up a run (page 21). PrimePCR Run Setup Open the Run Setup window with the default PrimePCR™ protocol and plate layout loaded based on the instrument selected.
MiniOpticon Instruction Manual Detected Instruments Pane The connected instrument appears in the Detected Instruments pane (Figure 8). This list shows each instrument as an icon named with the serial number (default). Right-click on the instrument in the Detected Instruments pane to open the Instrument Properties window and rename the instrument. Figure 8. Instruments listed in the Detected Instruments pane. Right-click on the instrument icon to select one of these options: • View Status.
CFX Manager™ Software Instrument Properties Window To open the Instrument Properties window to view information about an instrument, right-click on the instrument icon in the Detected Instruments pane (Figure 8). The window includes two tabs (Figure 10): • Properties. View serial numbers of the MiniOpticon system • Calibrated Dyes. View the list of calibrated fluorophores Figure 10. Instrument Properties window.
MiniOpticon Instruction Manual Master Mix Calculator To open the Master Mix Calculator, click the Master Mix Calculator button in the toolbar (Figure 12) or select Tools > Master Mix Calculator from the main window. Figure 12. Master Mix Calculator window. To set up a reaction master mix: 1. Select either SYBR® Green/EvaGreen or Probes detection method. 2.
CFX Manager™ Software WARNING! Removing a target from the target list also removes it from any master mixes calculations it is used in. 5. Adjust the Supermix concentration, reaction volume per well, excess reaction volume, the volume of template that will be added to each well, and the number of reactions that will be run. 6. Check the checkbox next to the target (only one can be chosen per SYBR® Green/ EvaGreen master mix) or targets (for probe multiplex reactions).
MiniOpticon Instruction Manual To Set up the Scheduler 1. The first time Scheduler is opened, any User, Instrument, and SMTP email settings will be imported from CFX Manager software. 2. To add a new instrument, select View > Instrument Details or click the Manage Instruments button below the Instruments list (Figure 13) in the scheduler main window. In the Instrument Details window, enter the instrument name in the Name column.
CFX Manager™ Software Scheduler Menu Bar The Scheduler menu bar contents are listed in Table 9. Table 9. Menu bar items in the Scheduler Menu Item Command Function File Print Preview View Print Exit Instrument Details Open the print preview window to adjust print settings. Print the calendar as it appears on the screen. Exit the scheduler. Open the instrument details window to view, edit, add, or delete the name, model, base or optical head serial numbers.
MiniOpticon Instruction Manual Figure 15. Scheduler New Event window. Cleanup events Select Tools > Cleanup Events to delete events from the calendar older than the period of time specified in the scheduler options window (Figure 16). WARNING! All events older than the specified date will be deleted. Scheduler Options Select Tools > Options to define Scheduler display, cleanup and launch settings. Click Restore Defaults to restore the Scheduler default settings. Figure 16. Scheduler Options window.
CFX Manager™ Software 20
MiniOpticon Instruction Manual 3 Performing Runs Read this chapter for information about performing runs using CFX Manager™ software: • Run Setup window (page 21) • Prime PCR™ runs (page 22) • Protocol tab (page 23) • End point only runs (page 23) • Plate tab (page 23) • Start Run tab (page 24) • Run Details window (page 25) • Instrument Summary window (page 28) Run Setup Window The Run Setup window provides quick access to the files and settings needed to set up and start a run.
Performing Runs • Start Run. Click the Start Run tab (page 24) to check the run settings, select one or more instrument blocks, and begin the run NOTE: If the protocol currently selected in the Protocol tab does not include a step with a plate read for real-time PCR analysis, then the Plate tab is hidden. To view the Plate tab, add a “Plate Read” (page 33) in at least one step in the protocol.
MiniOpticon Instruction Manual • File > Open > PrimePCR Run File... from the main window Once a PrimePCR run has been selected, the Run Setup window will open on the Start Run tab with the default PrimePCR protocol and plate layout loaded based on the instrument selected. To reduce the overall run time, the melt step can be removed by unchecking the box adjacent to Include Melt Step on the Protocol tab.
Performing Runs • Create New button. Open the Plate Editor to create a new plate • Select Existing button. Open a browser window to select and load an existing plate file (.pltd extension) into the Plate tab • Express Load pull-down menu. Quickly select a plate to load it into the Plate tab TIP: To add or delete plates in the Express Load menu, add or delete files (.pltd extension) in the ExpressLoad folder. To locate this folder, select Tools > User Data Folder in the menu bar of the main software window.
MiniOpticon Instruction Manual Figure 19. Start Run tab. NOTE: You can override the Sample Volume loaded in the Protocol file by selecting the volume in the spreadsheet cell and typing a new volume. NOTE: A run ID can be entered for each block by selecting the cell and typing an ID or by selecting the cell and scanning with a bar code reader. To add or remove run parameters from the spreadsheet in the Start Run on Selected Block(s) pane, right-click on the list and select an option in the menu to display.
Performing Runs Figure 20 shows the features of the Run Details window. Figure 20. Run Details window showing the Run Status tab. Run Status Tab The Run Status tab (Figure 20) shows the current status of a run in progress in the Run Details window and provides buttons (see below) to control the lid and change the run in progress. • Run Status pane. Displays the current progress of the protocol. • Run Status buttons.
MiniOpticon Instruction Manual Table 10. Run Status buttons and their functions (continued) Button Function Skip the current step in the protocol. If you skip a GOTO step, the software verifies that you want to skip the entire GOTO loop and proceed to the next step in the protocol. Flash the run indicating LED on the MiniOpticon system. Pause the protocol. NOTE: This action is recorded in the Run Log. Resume a protocol that was paused. Stop the run before the protocols ends, which may alter your data.
Performing Runs Editing a Plate Setup The plate setup can be viewed and edited while a run is in progress by selecting the View/Edit Plate button in the Real-Time Status tab. The Plate Editor window will then be presented and edits can be made as outlined in Chapter 5 (Plates). The trace styles can also be edited from the Plate Editor window and any changes made will be visible in the amplification trace plot in the Real-Time Status tab.
MiniOpticon Instruction Manual Instrument Summary Toolbar The Instrument Summary toolbar includes buttons and functions listed in Table 11. Table 11. Toolbar buttons in the Instrument Summary window Button Button Name Function Set Up Experiment Set up an experiment on the selected block by opening the Experiment Setup window. Stop Stop the current run on selected blocks. Pause Pause the current run on selected blocks. Resume Resume the run on selected blocks.
Performing Runs 30
MiniOpticon Instruction Manual 4 Protocols Read the following chapter for information about creating and editing protocol files: • Protocol Editor window (page 31) • Protocol Editor controls (page 33) • Temperature control mode (page 36) • Protocol AutoWriter (page 37) Protocol Editor Window A protocol instructs the instrument to control the temperature steps, lid temperature, and other instrument options.
Protocols • Protocol Editor buttons. Edit the protocol by clicking one of the buttons to the left of the text view Figure 23. Protocol Editor window with buttons for editing protocols. Protocol Editor Menu Bar The menu bar in the Protocol Editor window provides the menu items listed in Table 12 Table 12. Protocol Editor menu bar Menu Item Command Function File Save Save As Save the current protocol. Save the current protocol with a new name or in a new location. Close the Protocol Editor.
MiniOpticon Instruction Manual Table 13 lists the function of the Protocol Editor toolbar buttons: Table 13. Protocol Editor toolbar buttons Toolbar Button and Menus Name Function Save Save the current protocol file. Print Print the selected window. Insert Step Select After or Before to insert steps in a position relative to the currently highlighted step. Sample Volume Enter a sample volume in µl between 0 and 50. If you are using higher than 50 µl reactions, select 50 µl.
Protocols 2. Click the Add Plate Read to Step button to add a plate read to the selected step. If the step already contains a plate read, the text on the button changes, so now the same button reads Remove Plate Read. Click to remove a plate read from the selected step. Insert Gradient Button To insert a gradient step before or after the currently selected step: 1. Insert a temperature gradient step by clicking the Insert Gradient button. 2.
MiniOpticon Instruction Manual 2. Edit the GOTO step number or number of GOTO repeats by clicking the default number in the graphic or text view, and entering a new value. Figure 24 shows an inserted GOTO step at the end of the protocol. Notice that the GOTO loop includes steps 2 through 4. Insert Melt Curve Button To insert a melt curve step before or after the selected step: 1. Click the Insert Melt Curve button. 2.
Protocols Figure 26 shows the selected step with a gradient of 10oC. Notice that some options are not available in a gradient step. A gradient step cannot include an increment or ramp rate change. Figure 26. Step option for a gradient. NOTE: A gradient runs with the lowest temperature in the front of the block (row H) and the highest temperature in the back of the block (row A). The Step Options window lists the following options you can add or remove from steps: • Plate Read.
MiniOpticon Instruction Manual • Calculated mode. When you enter a sample volume between 1 and 50 µl the thermal cycler calculates the sample temperature based on the sample volume. This is the standard mode • Block mode. When you enter a sample volume of zero (0) µl, the thermal cycler records the sample temperature as the same as the measured block temperature Protocol AutoWriter Open the Protocol AutoWriter to quickly write protocols for PCR and real-time PCR runs.
Protocols 3. Select an enzyme type from the list of options (iTaq™, iProof™, or Other). 4. Add parameters in the Additional Parameters (Optional) pane if you want to add a Gradient Range, Hot Start Activation temperature, or Final Extension time in the protocol. 5. Select a protocol speed (Standard, Fast, or Ultrafast) by moving the sliding bar in the Type pane. When you move the sliding bar, the software adjusts the total run time. Select Real-time PCR to tell the software to collect fluorescence data. 6.
MiniOpticon Instruction Manual 5 Plates Read this chapter for information about creating and editing plate files: • Plate Editor window (page 39) • Plate size and type (page 42) • Select Fluorophores window (page 44) • Well loading controls (page 45) • Experiment Settings window (page 48) • Well selector right-click menu items (page 49) • Well Groups Manager window (page 50) • Plate Spreadsheet View/Importer window (page 51) Plate Editor Window A plate file contains run parameters, such as scan mode and
Plates Figure 28. Plate Editor window. Plate Editor Menu Bar The menu bar in the Plate Editor window provides the menu items shown in Table 14. Table 14. Menu bar items in the Plate Editor. Menu Item Command Function File Save View Save As Exit Show Well Notes Save the plate files. Save the plate file with a new file name. Exit the Plate Editor. Select to show this pane in the well loading controls. Enter notes about one or more wells. Select to show this pane in the well loading controls.
MiniOpticon Instruction Manual Table 14. Menu bar items in the Plate Editor. (continued) Menu Item Command Function Plate Type Choose the type of wells in the plate that holds your samples. The MiniOpticon system is only factory calibrated for BR White plates. For accurate data analysis, the plate type must be the same as the plate well type used in the experiment. NOTE: You must calibrate new plate types. Select or cancel the selection for Scientific Notation.
Plates Table 15. Plate Editor toolbar buttons. (continued) Toolbar Item Name Function Plate Loading Show a quick guide about how to set up a plate and load Guide the wells. Plate Size and Type The software applies these plate settings to all the wells during the experiment: • Plate Size. Select a plate size that represents the size of the reaction module block of your instrument.
MiniOpticon Instruction Manual Figure 29. Auto layout tab of Setup Wizard. Create a plate layout by following these steps: 1. Auto layout tab. Select the area in which samples will be located on the plate by clicking on a well at one edge and then dragging to encompass the area required. Enter the number of targets and samples to be loaded. If the numbers entered do not fit in the area selected, you will need to reduce the numbers or increase the plate area.
Plates 6. Click OK to apply the information entered to your plate. Any additional edits can be made using the Plate Editor. NOTE: Returning to the Auto layout tab will reset the plate layout. The layout can also be reset by selecting Tools > Clear Plate. TIP: To read text within wells of the plate layout more easily, click the Zoom plate box for a magnified view.
MiniOpticon Instruction Manual Well Loading Controls A plate file contains information about the contents of each well loaded with sample for a run. After the run, the software links the well contents to the fluorescence data collected during the protocol and applies the appropriate analysis in the Data Analysis window. For example, wells loaded with standard sample type are used to generate a standard curve.
Plates Table 16. Options for loading the plate and wells in the Plate Editor. (continued) Option Function For gene expression analysis or to distinguish among multiple samples, select a Sample Name from the pulldown menu to load that sample name in the selected wells. To delete a sample name, select it in the menu, press the Delete key on your keyboard, and then press Enter.
MiniOpticon Instruction Manual Table 16. Options for loading the plate and wells in the Plate Editor. (continued) Option Function Click the Dilution Series button to enter a dilution series for the concentration of Standard samples, and load a standard curve. Enter the Starting Concentration for the dilution series, the Replicates from (starting replicate number) and to (ending replicate number), and the Dilution Factor (amount to change the concentration with each replicate group).
Plates Experiment Settings Window To open the Experiment Settings window, perform one of these options: • In the Plate Editor, click the Experiment Settings button • While analyzing data in the Data Analysis window, click the Experiment Settings button in the Gene Expression tab Open the Experiment Settings window to view or change the list of Targets and Samples (Figure 31) or to set the gene expression analysis sample group to be analyzed if Biological Set Names have been added to the wells. • Targets.
MiniOpticon Instruction Manual To adjust the lists in these tabs, use the following functions: • Add a target or sample name by typing a name in the New box, and clicking Add • Remove a target or sample name from the list by clicking the Select to Remove box for that row, and then clicking the Remove checked item(s) button • Select the target as a reference for gene expression data analysis by clicking the box in the Reference column next to the name for that target • Select the sample as a control sample
Plates Well Groups Manager Window Well groups divide a single plate into subsets of wells that can be analyzed independently in the Data Analysis window. Once well groups are set up, select one in the Data Analysis window to analyze the data as an independent group. For example, set up well groups to analyze multiple experiments run in one plate, or to analyze each well group with a different standard curve. NOTE: The default well group is All Wells.
MiniOpticon Instruction Manual Plate Spreadsheet View/Importer Window The Plate Spreadsheet View window shows the contents of a plate in the Plate Editor. Open the Plate Spreadsheet View window (Figure 34) by selecting Editing Tools > Spreadsheet View/Importer in the Plate Editor menu bar. Figure 34. Plate Spreadsheet View window.
Plates 52
MiniOpticon Instruction Manual 6 Data Analysis Overview Read this chapter for information about data analysis: • Data Analysis window (page 53) • Quantification tab (page 56) • Well groups (page 57) • Data analysis settings (page 58) • Well selectors (page 61) • Charts (page 63) • Spreadsheets (page 64) • Export (page 65) Data Analysis Window During data analysis, changing the way the data are displayed by changing the contents of the wells in the Plate Editor never changes the fluorescence data that wer
Data Analysis Overview • Select File > Recent Data Files to select from a list of the ten most recently opened data files The Data Analysis window displays multiple tabs (Figure 35), each tab showing the analyzed data for a specific analysis method or run-specific information. Tabs will only be displayed if the data collected in the run are available for that type of analysis. Figure 35. Data Analysis window tabs. TIP: To choose the tabs displayed, select View in the main windown.
MiniOpticon Instruction Manual Data Analysis Menu Bar The menu bar in the Data Analysis window provides these menu items. Table 19 lists the functions of items in the menu bar. Table 19. Right-click menu items for spreadsheets. Menu Item Command Function File Save Save As Repeat Run Save the file. Save the file with a new name. Extract the protocol and plate file from the current run to rerun it. Exit the Data Analysis window. Open a Run Log window to view the run log of those data file.
Data Analysis Overview Table 19. Right-click menu items for spreadsheets. (continued) Menu Item Command Function Custom Export... Open the Custom Export window in which the fields to be exported and the file format can be specified. Open a window to save data in a predetermined format to the LIMS folder. Open the Report for this data file. Open the Well Group Report window to generate reports for specified well groups. Select a calibration file to apply to the current data file. Export to LIMS Folder.
MiniOpticon Instruction Manual Step Number Selector The MiniOpticon™ system can acquire fluorescence data at multiple protocol steps; the software maintains the data acquired at each step independently. The software displays the Step Number selector below the Standard Curve chart on the Quantification tab whenever a protocol contains more than one data collection step. When you select a step, the software applies that selection to all the data that are shown in the Data Analysis window.
Data Analysis Overview Data Analysis Settings The Amplification chart data in the Quantification tab shows the relative fluorescence (RFU) for each well at every cycle. Each trace in the chart represents data from a single fluorophore in one well. These data are used to determine Cq values for each well on a per fluorophore basis. The software uses one of two modes to determine Cq values: • Regression.
MiniOpticon Instruction Manual Baseline Settings The software automatically sets the baseline individually for each well. Select the Baseline Setting to determine the method of baseline subtraction for all fluorescence traces. Select Settings > Baseline Setting to choose one of these three options: • No Baseline Subtraction. The software displays the data as relative fluorescence traces.
Data Analysis Overview When Fluorophore is chosen data traces are displayed by fluorophore as indicated in the plate setup for that run. Individual fluorophore data is displayed in the amplification and standard curve chart (if available) by checking the appropriate fluorophore selector check boxes located below the amplification chart (Figure 41). Figure 41. Fluorophore analysis mode selected. When Target is selected data traces are displayed by target name as entered in the plate setup. Figure 42.
MiniOpticon Instruction Manual Cycles to Analyze To restrict data analysis to a specified range of cycles, select Settings > Cycles to Analyze. Select the starting cycle and the ending cycle using the arrow buttons or by typing in the desired values and pressing Enter. Click the Restore Defaults button to return to the cycles originally used for analysis. NOTE: Removing cycles from the beginning of a run can have a significant impact on baselining.
Data Analysis Overview Well Selector Right-Click Menu Items Right-click on well(s) in the well selector view to select the items listed in Table 20. Table 20. Right-click menu items in the well selectors Item Function Well XX View only this well, remove this well from view, set color for this well, or exclude this well from analysis. View only these wells, remove these wells from view, set color for these wells, or exclude these wells from analysis.
MiniOpticon Instruction Manual USING THE PLATE EDITOR 1. Click the Plate Setup button on the toolbar in the Data Analysis window. 2. Clicks View/Edit Plate... 3. Select one or more wells in the well selector view. 4. Click Exclude Wells in Analysis (Figure 45) to exclude the selected wells. This checkbox is at the bottom of the Plate Editor controls on the right side of the window. Figure 45. Exclude Wells in Analysis Checkbox at bottom of the pane. 5.
Data Analysis Overview Table 21. Right-click menu items for charts (continued) Item Function Page Setup... Print... Show Point Values Preview and select page setup for printing. Print the chart. Show the point values when the mouse moves over a point on the chart. Return to the default chart view after magnifying the chart. Open the Chart Options window to change the chart, including changing the title, selecting limits for the x and y axes, showing grid lines, and showing minor ticks in the axes.
MiniOpticon Instruction Manual Table 22. Right-click menu items for spreadsheets. (continued) Item Function Print... Print Selection... Export to Excel... Export to Text... Export to Xml... Export to Html... Find... Sort... Select Columns... Print the current view. Print the current selection. Export the data to an Excel spreadsheet. Export the data to a text editor. Export the data to an Xml file. Export the data to an Html file. Search for text. Sort the data in up to three columns.
Data Analysis Overview Figure 46. Custom Export window. 1. Select the export format from the following file export formats (Text *.txt, CSV *.csv, Excel 2007 *.xlsx, Excel 2003 *.xls, XML *.xml, and HTML *.html). 2. Select the items to be exported by checking the appropriate check boxes. 3. Click the Export button to open a Save As window to specify the file name and location for the exported file. Export to LIMS Folder LIMS compatibility is not currently available for the MiniOpticon™ system.
MiniOpticon Instruction Manual 7 Data Analysis Windows Read this chapter for more information about the tabs in the Data Analysis window: • Quantification tab (page 67) • Quantification Data tab (page 71) • Melt Curve tab (page 74) • Melt Curve Data tab (page 75) • End Point tab (page 77) • Allelic Discrimination tab (page 79) • Custom Data View tab (page 81) • QC tab (page 82) • Run Information tab (page 83) • Data file reports (page 84) • Well Groups Reports (page 87) NOTE: The tabs displayed in the dat
Data Analysis Windows • Spreadsheet. Shows a spreadsheet of the data collected in the selected wells Figure 47. Layout for the Quantification tab in Data Analysis window. Fluorophore Selector To select the fluorophore data to display in the Quantification tab charts and spreadsheets, click the fluorophore selector below the Amplification chart. Click the box next to the fluorophore name to show or hide the fluorophore data throughout the data analysis window.
MiniOpticon Instruction Manual Figure 48. Trace Styles window. Use the tools in the Trace Styles window to adjust the appearance of traces and preview the changes in the well selector at the bottom of the window. • Select a specific set of wells by using the well selector.
Data Analysis Windows Standard Curve Chart The software creates a Standard Curve chart (Figure 50) in the Quantification tab if the data include sample types defined as standard (Std) for one fluorophore in the run. Figure 50. Standard Curve chart. The Standard Curve chart displays the following information: • Name for each curve (the fluorophore or target) • Color of each fluorophore or target • Reaction efficiency (E).
MiniOpticon Instruction Manual Table 23. Right-click menu items for spreadsheets. (continued) Menu Option Baseline Thresholds... Function Open the Baseline Thresholds window to change baseline or thresholds of each fluorophore (changes appear in Amplification chart in Quantification tab). Quantification Tab Spreadsheet Table 24 shows the type of data shown in the spreadsheet at the bottom right side of the Quantification tab: Table 24.
Data Analysis Windows NOTE: All Std. Dev (standard deviation) calculations apply to the replicate groups assigned in the wells in the Plate Editor window. The calculations average the Cq value for each well in the replicate group. The Results spreadsheet includes the type of information listed in Table 25. Table 25. Results spreadsheet content Information Description Well Fluor Target Content Sample Biological Set Name Cq Well position in the plate. Fluorophore detected.
MiniOpticon Instruction Manual Table 26. Standard Curve Results spreadsheet contents Information Description Fluor (or Target) Efficiency % Slope Y-intercept R^2 Fluorophore (or Target) detected. Reaction efficiency. Slope of the standard curve. Point at which the curve intercepts the y-axis. Coefficient of determination. Plate Spreadsheet Select the Plate spreadsheet to see a plate map of the data for one fluorophore at a time.
Data Analysis Windows RFU Spreadsheet Select the RFU spreadsheet to see the relative fluorescence units (RFU) readings for each well acquired at each cycle of the run. Select individual fluorophores by clicking a tab at the bottom of the spreadsheet. The well number appears at the top of each column, and the cycle number appears to the left of each row (Figure 54). Figure 54. RFU spreadsheet in the Quantification Data tab.
MiniOpticon Instruction Manual Figure 55. Layout of the Melt Curve tab in the Data Analysis window.
Data Analysis Windows Melt Peaks Spreadsheet Select the Melt Peaks spreadsheet (Figure 56) to view melt curve data. Figure 56. Melt Peaks spreadsheet in the Melt Curve Data tab. The Melt Peaks spreadsheet (Figure 56) includes the type of information shown in Table 27. Table 27. Melt Peaks spreadsheet content Information Description Well Fluor Content Target Sample Melt Temperature Well position in the plate. Fluorophore detected. Sample Type listed in the Plate Editor window.
MiniOpticon Instruction Manual RFU Spreadsheet Select the RFU spreadsheet to view the fluorescence for each well at each cycle acquired during the melt curve. Table 29 lists the types of information shown in the RFU spreadsheet. Table 29. RFU spreadsheet content Information Description Well number (A1, A2, A3, A4, Well position in the plate for the loaded wells. A5...) Temperature Melting temperature of the amplified target.
Data Analysis Windows • Results. Shows the results immediately after you adjust the Settings • Well selector. Select the wells with the end point data you want to show • Well spreadsheet. Shows a spreadsheet of the end RFU collected in the selected wells Figure 57. Layout of the End Point analysis tab. The Results list includes this information: • Lowest RFU value. Lowest RFU value in the data • Highest RFU value. Highest RFU value in the data • Negative Control Average.
MiniOpticon Instruction Manual • Select Percentage of Range to view the data as a percentage of the RFU range • Select wells in the well selector to focus on subsets of the data • Select a well group (page 57) to view and analyze a subset of the wells in the plate. Select each well group by name in the Well Group pull-down menu in the toolbar Data Description for End Point Analysis Table 31 lists the types of information shown in the spreadsheet in the End Point tab. Table 31.
Data Analysis Windows • Well spreadsheet. Shows a spreadsheet listing the allelic discrimination data collected in the selected wells Figure 58. Layout of the Allelic Discrimination tab in the Data Analysis window. Adjusting Data for Allelic Discrimination The software automatically assigns a genotype to wells with unknown samples based on the positions of the vertical and horizontal threshold bars, and then lists genotype calls in the spreadsheet view.
MiniOpticon Instruction Manual • Select Normalize Data to normalize the RFU data shown in the chart and spreadsheet Normalization changes the data on the chart to a range from 0 to 1 on both axes. To normalize the data, the plate must contain wells with “no template control” (NTC) sample types for both Allele 1 and Allele 2. For this plot, the RFU data are normalized to the NTC values as a linear combination of Allele 1- and Allele 2-specific RFUs. This plot is an effective way to present RFU data.
Data Analysis Windows • Changing individual pane dimensions by clicking and dragging the bars at the periphery of each pane. Customized views can be saved as new preset templates by clicking Save as Preset. Existing presets can be deleted, renamed, or the default preset views restored using Manage Presets. Figure 59. Custom Data View window.
MiniOpticon Instruction Manual Figure 60. QC tab layout. Excluding Wells that Fail QC Wells failing QC criteria are listed in the results column of the QC rules table and in the summary pane. These wells can be excluded, or included, in analysis by checking or unchecking the appropriate Exclude Wells checkbox. Run Information Tab The Run Information tab (Figure 61) shows the protocol and other information about each run.
Data Analysis Windows Figure 61. Layout of the Run Information tab in the Data Analysis window. TIP: Right-click the Protocol to copy, export, or print it. Right-click the Notes, ID, or Other pane to undo, cut, copy, paste, delete, or select the text. Data File Reports The Report window (Figure 62) shows information about the current data file in the Data Analysis window. To open a report, select Tools > Reports, or click the Reports button on the toolbar in the Data Analysis window.
MiniOpticon Instruction Manual Create a Data Analysis Report To create a report in the Data Analysis window, follow these steps: 1. Make final adjustments to the well contents, selected wells, charts, and spreadsheets in the Data Analysis window before creating the report. 2. Click the Report button in the Data Analysis toolbar to open the Report window. 3. Change the options you want to include in the report. The report opens with default options selected.
Data Analysis Windows Table 33. Data analysis report categories in the options list.
MiniOpticon Instruction Manual Well Group Reports To create reports for specific well groups: 1. Select Tools > Well Group Reports in the Data Analysis window. Figure 63. Well Group Reports window. 2. From the Well Groups Reports window (Figure 63) the Well Groups, Amplification Steps, and Melt Steps to be included in the reports can be specified by checking the appropriate box. 3. The destination folder can be changed to another location by clicking the ... button. 4.
Data Analysis Windows 88
MiniOpticon Instruction Manual 8 Gene Expression Analysis Read this chapter for information about performing Gene Expression Analysis: • Gene Expression (page 89) • Plate setup for gene expression analysis (page 90) • Guided plate setup (page 90) • Bar Chart (page 91) • Clustergram (page 97) • Scatter Plot (page 98) • Volcano Plot (page 99) • Heat Map (page 100) • Results (page 101) • Gene Study (page 101) • Gene Study Report window (page 104) • Gene expression calculations (page 106) Gene Expression Wit
Gene Expression Analysis • Relative expression level of one target sequence in one sample compared to the same target under different sample treatments. For example, the relative amount of one gene relative to itself under different temporal, geographical, or developmental conditions Plate Setup for Gene Expression Analysis To perform gene expression analysis, the contents of the wells must include the following: • Two or more targets.
MiniOpticon Instruction Manual • Replace PrimePCR File. Select a PrimePCR™ run file from which to apply the plate layout information 2. Select Reference Targets and Control Sample using • Experiment Settings... This will open the Experiment Settings window so that one or more reference targets and a control sample can be selected If the plate layout already contains target and sample information, only the second step is required and will be highlighted in orange.
Gene Expression Analysis To set up normalized gene expression (Cq) analysis, follow these steps: 1. Open a data file (.pcrd extension). 2. Review the data in the Quantification tab of the Data Analysis window. Make adjustments to the data, such as changing the threshold and the Analysis Mode. 3. Click the Gene Expression tab. 4. Choose a control in the Samples tab of the Experiment Settings window.
MiniOpticon Instruction Manual • Sample. Select this option to graph the sample names on the x-axis Y-AXIS OPTIONS The Y-axis option allows you to show the Gene Expression graph in one of these three scales: • Linear. Select this option to show a linear scale • Log 2. Select this option to evaluate samples across a large dynamic range • Log 10.
Gene Expression Analysis Right-Click Menu Options Right-click on the Gene Expression graph to select the items shown in Table 35. Table 35. Right-click menu items Item Function Copy Save as Image Copy the chart to a clipboard Save the graph in the chart view as an image file. The default image type is PNG.
MiniOpticon Instruction Manual Show Details Option When Show Details is selected from the right-click menu of the Gene Expression spreadsheet, the spreadsheet shows the information listed in Table 37. Table 37. Information in the Gene Expression spreadsheet with Show Details selected.
Gene Expression Analysis • Add a target or sample name by typing a name in the New box, and clicking Add • Remove a target or sample name from the list by clicking the Remove Name box for that row, and then clicking the Remove checked item(s) button • Select the target as a reference for gene expression data analysis by clicking the box in the Reference column next to the Name for that target • Select the sample as a control sample for gene expression data analysis by clicking the box in the Control column
MiniOpticon Instruction Manual Figure 68 shows the efficiency of all the targets, which appear if Auto Efficiency is selected. Figure 68. Targets tab in the Experiment Settings window with Analysis Settings selected.
Gene Expression Analysis The clustergram image depicts relative expression of a sample or target as follows: • Upregulation (red). Relatively higher expression • Downregulation (green). Relatively lower expression • No regulation (black) • No value calculated (black with a white X) The lighter the shade of color, the greater the relative expression difference. If no normalized Cq value can be calclulated the square will be black with a white X.
MiniOpticon Instruction Manual • Upregulation (red circle). Relatively higher expression • Downregulation (green circle). Relatively lower expression • No change (black circle) Click and drag either threshold line to adjust the regulation threshold value. TIP: To change the symbol used for a scatter or volcano plot, choose Symbol from the right-click menu and select one from the options presented. Settings The following can be set: • Control sample • Experimental sample • Regulation threshold.
Gene Expression Analysis • Downregulation (green circle). Relatively lower expression • No change (black circle) Click and drag either vertical threshold line to adjust the regulation threshold value. Settings The following can be set: • Control sample • Experimental sample • Regulation or P-Value threshold. Enter or adjust the value using arrows and the plot threshold lines will be moved appropriately Right-Click Menu Options Right-click on the volcano plot to select the items shown in Table 39.
MiniOpticon Instruction Manual Right-click on the heat map to select the items shown in Table 38. Data Spreadsheet The spreadsheet lists the target, sample, and regulation. Select chart options by right-clicking. Results The Results spreadsheet summarizes the data from all of the charts. The contents of the Results spreadsheet are listed in Table 40. Table 40. Information in the Results tab.
Gene Expression Analysis For the software to recognize a sample as an inter-plate calibrator, it must share matching target name, sample name, and if used, collection name, across every plate being compared. NOTE: At least one inter-run calibrator sample must be present in the Gene Study for inter-run calibration to occur. Targets without appropriate inter-run calibrator samples will be processed without correction in the Gene Study (not recommended).
MiniOpticon Instruction Manual Figure 70 shows the Gene Study window, including the Study Setup and Study Analysis tabs. Figure 70. Study Setup tab in the Gene Study window. Study Setup Tab Before importing data into a Gene Study, do the following in the Data Analysis window: • Check that samples containing the same content are named with the same name.
Gene Expression Analysis Table 41. Study Setup tab in the Gene Study window.
MiniOpticon Instruction Manual Category Study AnalysisClustergram, Scatter Plot, Volcano Plot, and Heat Map Option Description Chart Target Names Sample Names Data Target Stability Inter-run Calibration Analysis Settings Gene Expression chart showing the data List of targets in the Gene Study List of samples in the Gene Study Spreadsheet that shows the data Target stability data Inter-run calibration data A list of the selected analysis parameters Chart Data Gene Expression chart showing the data Sp
Gene Expression Analysis Gene Expression Calculations CFX Manager™ software calculates formulas automatically and displays the resulting information in the Data Analysis tabs. Reaction Efficiency Evidence suggests that using accurate measure of efficiencies for each primer and probe sets will give you more accurate results when analyzing gene expression data. The default value of efficiency used in the gene expression calculations is 100%.
MiniOpticon Instruction Manual Standard Deviation of Relative Quantity The standard deviation of the relative quantity is calculated with the following formula: SD Relative Quantity = SD Cq GOI Relative Quantity Sample X Ln (E GOI Where: • SD Relative Quantity = standard deviation of the relative quantity • SD Cq sample = Standard deviation of the Cq for the sample (GOI) • Relative Quantity = Relative quantity of the sample • E = Efficiency of primer and probe set.
Gene Expression Analysis Normalization Factor The denominator of the normalized expression equation is referred to as the normalization factor.
MiniOpticon Instruction Manual Standard Deviation for the Normalized Expression Re-scaling the normalized expression value is accomplished by dividing the standard deviation of the normalized expression by the normalized expression value for the highest or lowest individual expression levels, depending on the Scaling Option you choose.
Gene Expression Analysis • GOI = Gene of interest (target) Normalized Expression Scaled to Average Expression Level When the run does not include controls, scale the normalized expression (NE) for each target (gene) by dividing the expression level of each sample by the geometric mean level of expression of all the samples. The software sets the average level of expression to a value of 1 and rescales all the sample expression levels.
MiniOpticon Instruction Manual P-Value The p-value is a measure of the statistical significance of an experimental sample data point compared to a control. NOTE: At least two replicates are required for both control and experimental samples for a p-value to be determined. The more replicates that are present, the greater the accuracy.
Gene Expression Analysis Where • n = Number of reference targets (genes) • SD = Standard deviation The standard error for the normalization factor in the normalized expression formula is shown here: SE RQ sample (Ref n) 2 SE RQ sample (Ref 1) 2 SE RQ sample (Ref 2) 2 SE NF n = NF n -------------------------------------------------------- + --------------------------------------------------------- + + ------------------------------------------------------- n SE RQ n SE RQ n SE
MiniOpticon Instruction Manual 9 Users and Preferences Read this chapter to learn more about managing software users and their preferences: • Log in or Select User (page 113) • User Preferences window (page 114) • Configuring email notification (page 115) • User Administration (page 122) Log in or Select User CFX Manager™ software manages multiple users and their preferences. The current, logged in software user is displayed at the top of the main software window.
Users and Preferences Change a Password Change a password by following these steps: 1. Select User > Change Password from the main software window menu to open the Change Password dialog box (Figure 73). 2. Enter the old password in the Old Password box. 3. Enter the new password in the New Password and the Confirm New Password boxes. 4. Click OK to confirm the change. Figure 73. Change Password dialog box.
MiniOpticon Instruction Manual TIP: Click the Restore Defaults button to restore all settings to the default settings shown in this image. Then click OK to save the settings, and close the window. Email Tab Select the Email tab (Figure 74) to enter the email addresses where you want to receive confirmation of the completion of runs. The software can send an attached data file or report file with the email when the checkboxes next to these options are checked.
Users and Preferences attachments by checking the Test Attachment box, and setting the Attachment Size in MB with up to 5 megabytes (MB) or more. Files Tab Select the Files tab to list the default locations for opening and saving files. • Default Folder for File Creation. Select a default folder where you want to save new files. Select a location for each file type (Protocol, Plate, Data, or Gene Study file) • File Selection for Run Setup.
MiniOpticon Instruction Manual • Protocol AutoWriter. Selects default settings that appear in the Protocol AutoWriter, including default Annealing Temperature for experiments that use iProof™, iTaq™, or other polymerases and the default amplicon length Figure 77. Protocol tab in the User Preferences window. Plate Tab Select the Plate tab in the User Preferences window (Figure 78) to specify the following default settings for a new Plate file in the Plate Editor window: • Plate Type.
Users and Preferences Figure 78. Plate tab in the User Preferences window. Data Analysis Tab Select the Data Analysis tab in the User Preferences window to change the default settings for data that appear in the Data Analysis window. Figure 79. Data Analysis tab in the User Preferences window. For analysis mode, select to analyze the data by either Fluorophore or Target.
MiniOpticon Instruction Manual For quantification data, select the following settings: • Baseline Setting. Select the default base lining method for Analysis mode. Choose Baseline Subtracted Curve Fit, No Baseline Subtraction, or Baseline Subtracted • Cq Determination Mode. Select between Regression mode or Single Threshold mode to determine how Cq values are calculated for each fluorescence trace • Log View. Select On to show a semi-logarithmic graph of the amplification data.
Users and Preferences Specify the default settings for a new Gene Expression data file: • Relative to. Select a control or zero. To graph the gene expression data originating at 1 (relative to a control), select Control. When you assign a control sample in the Experiment Setup window, the software automatically defaults to calculate the data relative to that control.
MiniOpticon Instruction Manual • NRT (no reverse transcriptase control) with a Cq less than XX. Input a Cq Cut-off Value • Positive control with a Cq greater than XX. Input a Cq Cut-off Value • Unknown without a Cq • Standard without a Cq • Efficiency greater than XX. Input a reaction efficiency Cut-off Value that is calculated for the standard curve • Efficiency less than XX. Input a reaction efficiency Cut-off Value that is calculated for the standard curve • Std Curve R^2 less than XX.
Users and Preferences The ordering of the items selected can be changed by highlighting the item and then using the arrow buttons to the left of the Exported Columns list to move them up or down. NOTE: Selecting Restore Defaults from any of the User Preferences tabs restores the default factory settings for all user preferences options.
MiniOpticon Instruction Manual 4. Click OK to open a dialog box and confirm that you want to close the window. 5. Click Yes to close the dialog box and window. To remove a software user, follow these steps: 1. In the Manage Users pane, click the box in the Delete list for each software user you want to remove. 2. Click OK to open a dialog box and confirm that you want to close the window. 3. Click Yes to close the dialog box and window.
Users and Preferences 124
MiniOpticon Instruction Manual 10 Resources Read this chapter to learn more about resources for the MiniOpticon™ system: • LIMS integration (page 125) • Calibration Wizard (page 126) • Instrument maintenance (page 127) • Application Log (page 128) • Troubleshooting (page 129) • References (page 130) LIMS Integration CFX Manager™ software can be configured for use with a Laboratory Information Management System (LIMS) when running a CFX96™ or CFX384™ real-time PCR detection system.
Resources Calibration Wizard The MiniOpticon system is factory calibrated for commonly used fluorophores in Bio-Rad white-welled plates (Table 43). Table 43. Factory calibrated fluorophores, channels, and instruments. Fluorophores Channel FAM, SYBR® Green I HEX 1 2 To open the Calibration Wizard to calibrate the MiniOpticon system: 1. Select an instrument in the Detected Instruments pane. 2.
MiniOpticon Instruction Manual plate in the block and close the lid for the second procedure of the calibration. Click OK to confirm that the plate is in the block. 6. When CFX Manager software completes the calibration run, a dialog box appears. Click Yes to finish calibration and open the Dye Calibration Viewer. 7. Click OK to close the window. Instrument Maintenance The MiniOpticon system includes a sensitive optical detector system and a sample block that must heat and cool very fast.
Resources • Clean the outer surface. Use a damp cloth or tissue to clean spills off the outside case. If needed, use a mild soap solution, and then rinse the surface with a damp cloth. Cleaning the cover will prevent corrosion NOTE: Never use cleaning solutions that are corrosive to aluminum, such as bleach or abrasive cleansers. • Use of oil in the wells is not recommended. If oil is used, the wells must be cleaned thoroughly and often. Remove the oil when it is discolored or contains dirt.
MiniOpticon Instruction Manual To open the Application Log in the main software window, select View > Application Log. Figure 86. Example of an Event Log file. Troubleshooting Typically, software and instrument communication problems can be resolved by restarting your computer and the system. Be sure to save any work in progress before restarting. NOTE: Check that your computer has sufficient RAM and free hard drive space. The minimum RAM is 2 GB and the minimum hard drive space is 20 GB.
Resources References Breslauer KJ, et al. (1986). Predicting DNA duplex stability from the base sequence. Proc Nat Acad Sci 83, 3746–50. Livak JL, et al. (1995). Towards fully automated genome-wide polymorphism screening. Nature Genetics 9, 341–342. Pfaffl MW. (2001). A new mathematical model for relative quantification in real-time RTPCR. Nucleic Acids Research 29(9), 2002–2007. Vandesompele J, et al. (2002).
MiniOpticon Instruction Manual Index How to, 8 Tube strips, 8 Baseline Window, 59 Baseline Settings, 59 Baseline Subtracted Curve Fit mode, 59 Baseline Subtracted mode, 59 Baseline Threshold window, 59 Beep, 36 Block, 2 Mode, 37 Button, 26 Clear Replicate #, 47 Clear Wells, 47 Close lid, 2, 26 Delete step, 36 Experiment Settings, 47, 48 Flash Block Indicator, 27 Open lid, 26 Pause, 27 Protocol AutoWriter, 37 Protocol Editor, 33 Resume, 27 Show Analysis Settings, 49, 96 Skip Step, 27 A Add Repeats, 26 Addi
Index Sample volume, 23, 33 Thresholds, 59 Chart Data analysis, 63 Cleanup events, 19 Clear Replicate #, 47 Clear Wells button, 47 Clearing wells in Plate Editor, 63 Close button for lid, 2 Close Lid button, 26 Closing the lid, 26 Coefficient of Variation, 93 Color, 44, 49, 97 Concentration, 45, 46 Control Relative quantity with, 106 Creating Data report, 85 Protocol, 37 Well groups, 50 Custom Data View, 81 Custom Export, 65 Cycles to Analyze, 60, 61 D -d(RFU)/dT Spreadsheet, 77 Data analysis About, 53 Adj
MiniOpticon Instruction Manual Right-click for graph, 94 Scaling options, 93 Spreadsheet, 94 Gene Study, 101 Inter-run calibration, 101 Preparing data, 103 Report, 104 Show Details, 104 Study Analysis tab, 102, 104 Study Setup tab, 103 GOI Normalization factor, 107, 108 Normalized expression, 108, 109, Relative quantity, 106, 107 SD Normalized expression, 110 GOTO Adding repeats, 26 Inserting, 34 Gradient Inserting, 34 Step, 34 Gradient Calculator, 32 H Heated plate, 2 I Import Template, 51 Increment, 36
Index Opening Lid, 26 Melt Curve tab, 74 Protocol AutoWriter, 37 Protocol Editor, 31 Operation requirements, 3 P Pause Button, 27 Run, 27 Plastic Consumables, 8 Plate Contents of wells, 45 Melt Curve Data, 76 Size, in Plate Editor, 40 Spreadsheet, 51, 76 Type, 41 Well contents, 45 Plate Editor Clear Replicate #, 47 Clear Wells button, 47 Clearing wells, 63 Concentration, 46 Dilution Series, 47 Experiment Settings, 47 Export plate spreadsheet, 51 Import plate spreadsheet, 51 Magnification, 41 Menu bar, 40
MiniOpticon Instruction Manual Allelic Discrimination, 79, 82 End Point tab, 77 Melt Curve tab, 74 Right-click Gene expression graph, 94 Run Adding repeats, 26 Cancelling, 27 Flash block, 27 Pausing, 27 Skipping a step, 27 Stopping, 27 Run Details Real-Time Status tab, 27 Run Status, 26 Time Status tab, 28 Window, 25 Run Information Tab, 83 Run Status Tab, 26 Spreadsheet Allelic Discrimination, 81 Amplification Data for Melt Curve, 77 -d(RFU)/dT for Melt Curve, 77 End Point, 79 Gene expression, 94 Melt Pea
Index Temperature control Block mode, 37 Mode, 36 Threshold Adjusting, 58 Thresholds Window, 59 Time Status tab, 28 Toolbar Data analysis, 54 Main software, 11 Plate Editor, 41 Trace Adjusting, 68 Color, 68 Style, 68 U Units, 41 USB Connections, 3 W Warning Instruments, iii Labels, iii Labels, safety, iii List in manual, ii, v, vi Risk of burning, iii Risk of explosion, iii Risk of harm, iii Safety, iii Well Concentration, 45 Contents, 45 Fluorophores, 45 Groups, 41 Notes, 45, 47 Sample Name, 45 Sample
Bio-Rad Laboratories, Inc. Life Science Group 10954 Rev J US/EG Web site www.bio-rad.