CFX96 Touch™, CFX96 Touch Deep Well™, CFX Connect™, and CFX384 Touch™ Real-Time PCR Detection Systems Instruction Manual Catalog #184-5096 #185-5196 #184-4096 #185-4096 #185-5200 #184-5384 #185-5484
©2013 Bio-Rad Laboratories, Inc. Reproduction in any form, either print or electronic, is prohibited without written permission of Bio-Rad Laboratories, Inc. Adobe, Acrobat, and Reader are trademarks of Adobe Systems Incorporated. Cy is a trademark of GE Healthcare Group companies. CAL Fluor and Quasar are trademarks of Biosearch Technologies, Inc. SYBR® and Texas Red are trademarks of Life Technologies Corporation.
Bio-Rad Resources Table 1 lists Bio-Rad resources and how to locate what you need. Table 1. Bio-Rad resources Resource How to Contact Local Bio-Rad Laboratories representatives Find local information and contacts on the Bio-Rad website by selecting your country on the home page (www.bio-rad.com). Find the nearest international office listed on the back of this manual. Technical notes and literature Go to the Bio-Rad website (www.bio-rad.com).
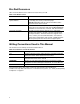
CFX96 Touch, CFX96 Touch Deep Well, CFX Connect, and CFX384 Touch Systems Instruction Manual Safety and Regulatory Compliance For safe operation of the CFX96 Touch system, CFX96 Touch Deep Well system, CFX Connect system, or CFX384 Touch system, we strongly recommend that you follow the safety specifications listed in this section and throughout this manual. Safety Warning Labels Warning labels posted on the instrument and in this manual warn you about sources of injury or harm.
Instrument Safety Warnings The warning labels shown in Table 4 also display on the instrument and refer directly to the safe use of the CFX96 Touch system, CFX96 Touch Deep Well system, CFX Connect system, and CFX384 Touch system. Table 4. Instrument safety warning labels Icon Meaning Warning about risk of harm to body or equipment. Operating the CFX96 Touch, CFX96 Touch Deep Well, CFX Connect, or CFX384 Touch realtime PCR detection system before reading this manual can constitute a personal injury hazard.
CFX96 Touch, CFX96 Touch Deep Well, CFX Connect, and CFX384 Touch Systems Instruction Manual • IEC 61010-2-081:2001+A1, EN61010-2-081:2002+A1. Safety requirements for electrical equipment for measurement, control, and laboratory use. Part 2-081: Particular requirements for automatic and semi-automatic laboratory equipment for analysis and other purposes (includes Amendment 1) • EN 61326-1:2006 (Class A). Electrical equipment for measurement, control, and laboratory use.
• No biohazardous substances are exhausted during normal operations of this instrument SURFACE DECONTAMINATION WARNING! To prevent electrical shock, always turn off and unplug the instrument prior to performing decontamination procedures.
CFX96 Touch, CFX96 Touch Deep Well, CFX Connect, and CFX384 Touch Systems Instruction Manual Transport Before moving or shipping the C1000 Touch or CFX Connect thermal cycler, or CFX96, CFX96 Deep Well, CFX Connect, or CFX384 optical reaction module, decontamination procedures must be performed.
viii
CFX96 Touch, CFX96 Touch Deep Well, CFX Connect, and CFX384 Touch Systems Instruction Manual Table of Contents Bio-Rad Resources . . . . . . . . . . . . . . . . . . . . . . . . . . . . . . . . . . . . . . . . . . . . . . . . . . ii Writing Conventions Used in This Manual . . . . . . . . . . . . . . . . . . . . . . . . . . . . . . . . ii Safety and Regulatory Compliance. . . . . . . . . . . . . . . . . . . . . . . . . . . . . . . . . . . . . iii Hazards . . . . . . . . . . . . . . . . . . . . . . . . . . .
Table of Contents Chapter 5. Plates . . . . . . . . . . . . . . . . . . . . . . . . . . . . . . . . . . . . . . . . . . . . . 45 Plate Editor Window . . . . . . . . . . . . . . . . . . . . . . . . . . . . . . . . . . . . . . . . . . . . . . . . Setup Wizard . . . . . . . . . . . . . . . . . . . . . . . . . . . . . . . . . . . . . . . . . . . . . . . . . . . . . . Select Fluorophores Window . . . . . . . . . . . . . . . . . . . . . . . . . . . . . . . . . . . . . . . . . Well Loading Controls . . . . . . .
CFX96 Touch, CFX96 Touch Deep Well, CFX Connect, and CFX384 Touch Systems Instruction Manual Chapter 9. Gene Expression Analysis . . . . . . . . . . . . . . . . . . . . . . . . . . . . 109 Gene Expression . . . . . . . . . . . . . . . . . . . . . . . . . . . . . . . . . . . . . . . . . . . . . . . . . . Plate Setup for Gene Expression Analysis . . . . . . . . . . . . . . . . . . . . . . . . . . . . . . Guided Plate Setup . . . . . . . . . . . . . . . . . . . . . . . . . . . . . . . . . . . . . . . . . . .
Table of Contents xii
CFX96 Touch, CFX96 Touch Deep Well, CFX Connect, and CFX384 Touch Systems Instruction Manual 1 System Installation Read this chapter for information about setting up the CFX96 Touch™, CFX96 Touch Deep Well™, CFX Connect™, or CFX384 Touch™ system: • Unpacking the optical reaction module (page 1) • System requirements (page 1) • System overview (page 2) • Setting up the system (page 4) • Installing CFX Manager™ software (page 8) • Software files (page 9) • Running experiments (page 10) Unpacking the Optica
System Installation • USB cable. If the system is going to be controlled by a computer via a USB cable, the provided cable from Bio-Rad is sufficiently shielded for use NOTE: For a full list of the safety and compliance requirements for this instrument, see “Safety and Regulatory Compliance” on page iii. System Overview The CFX96 Touch system, CFX96 Touch Deep Well system, CFX Connect system, and CFX384 Touch system includes two components: • Optical reaction module.
CFX96 Touch, CFX96 Touch Deep Well, CFX Connect, and CFX384 Touch Systems Instruction Manual When open, the CFX96 Touch, CFX96 Touch Deep Well, CFX Connect, and CFX384 Touch systems include the features shown in Figure 2. Inner lid with heater plate Block Close button Figure 2. Inside view of the CFX96 Touch system. WARNING! Avoid touching the inner lid or block: These surfaces can be hot. • Inner lid with heater plate.
System Installation Power switch Power input Ethernet USB connections port Figure 3. Back panel of C1000 Touch thermal cycler. WARNING! Avoid contact with the back panel of the C1000 Touch cycler during operation. Setting up the system The CFX96 Touch, CFX96 Touch Deep Well, CFX Connect, or CFX384 Touch real-time PCR detection system should be installed on a clean, dry, level surface with sufficient cool airflow to run properly.
CFX96 Touch, CFX96 Touch Deep Well, CFX Connect, and CFX384 Touch Systems Instruction Manual 2. Lift the optical reaction module using the handle indents above the side air vents (Figure 4). CFX96 optical reaction module C1000 Touch thermal cycler chassis Figure 4. Lifting the optical reaction module into the C1000 Touch chassis. 3. Position the module in the reaction module bay of the C1000 Touch or CFX Connect chassis, leaving about 2 cm of space in the front.
System Installation 4. Reach around and pull up the locking bar of the C1000 Touch or CFX Connect chassis until it is flush with the sides of the module bay. This action moves the module forward, locking it into place (Figure 5). Figure 5. Locking the optical module into place. 5. Check that the module is completely and evenly seated in the C1000 Touch or CFX Connect chassis. Check the space around the bottom of the module.
CFX96 Touch, CFX96 Touch Deep Well, CFX Connect, and CFX384 Touch Systems Instruction Manual Replacing Fuses Fuses on the CFX real-time PCR detection systems are designed to blow in case of severe power surges or other causes of electrical short. This protects both the user and the instrument from excessive electric charge. If the system does not turn on, first check that the power cord is plugged into a functioning power source.
System Installation Installing CFX Manager Software CFX Manager software is run on a personal computer (PC) with either the Windows XP, Windows 7, or Windows 8 operating system and is required to analyze real-time PCR data from the CFX96 Touch system, CFX96 Touch Deep Well system, CFX Connect system, or CFX384 Touch system. This software can also be used to control these systems in softwarecontrolled mode. Table 6 lists the computer system requirements for the software. Table 6.
CFX96 Touch, CFX96 Touch Deep Well, CFX Connect, and CFX384 Touch Systems Instruction Manual Figure 7. Software installation screen. Installing the Drivers If the CFX96 Touch, CFX96 Touch Deep Well, CFX Connect, or CFX384 Touch system is going to be run in software-controlled mode, drivers must be installed on the computer. Drivers will be automatically installed if using Windows 7 or Windows 8. To install the system drivers for Windows XP: 1.
System Installation Table 7. Open these file types with CFX Manager software (continued) File Type Extension How to View and Edit File Gene Study .mgxd View and analyze in Gene Study window Stand-alone pre-data .zpcr file Contains fluorescence readings from stand-alone operation that are converted into a data file LIMS Contains plate setup and protocol information required to conduct a LIMS compatible run .
CFX96 Touch, CFX96 Touch Deep Well, CFX Connect, and CFX384 Touch Systems Instruction Manual volumes of 10–25 μl for the CFX96 Touch or CFX Connect system, 10–125 for the CFX96 Touch Deep Well system, and 5–20 μl for the CFX384 Touch system NOTE: For accurate data analysis, check that the orientation of reactions in the block is exactly the same as the orientation of the well contents in the software Plate tab (see “Plate Tab” on page 29). If needed, edit the well contents before, during, or after the run.
System Installation 12
CFX96 Touch, CFX96 Touch Deep Well, CFX Connect, and CFX384 Touch Systems Instruction Manual 2 CFX Manager™ Software Read this chapter for information about getting started with CFX Manager software.
CFX Manager™ Software Main Software Window Features available in the main software window are indicated in Figure 9. Figure 9. The main software window. Menu Bar The menu bar of the main software window provides the items listed in Table 8. Table 8. Menu bar items in the main software window. 14 Menu Item Command Function File New Create a new protocol, plate, run, or gene study Open Open existing files, including protocol (.prcl), plate (.pltd), data (.pcrd), gene study (.mgxd), LIMS (.
CFX96 Touch, CFX96 Touch Deep Well, CFX Connect, and CFX384 Touch Systems Instruction Manual Table 8. Menu bar items in the main software window.
CFX Manager™ Software Table 8. Menu bar items in the main software window.
CFX96 Touch, CFX96 Touch Deep Well, CFX Connect, and CFX384 Touch Systems Instruction Manual Table 9. Toolbar buttons in the main software window. (continued) Button Button Name Function Startup Wizard Open the Startup Wizard to set up a run, repeat a run, or analyze a data file Startup Wizard The Startup Wizard automatically appears when CFX Manager software is first opened. If it is not shown, click the Startup Wizard button on the main software window toolbar.
CFX Manager™ Software • One CFX96™ system (CFX96SIM02) Figure 10. Instruments listed in the Detected Instruments pane. Right-click the instrument icon or block to select one of these options: • View Status. Open the Run Details window to check the status of the selected instrument block • Flash Block Indicator. Flash the indicator LED on the instrument • Open Lid. Open a motorized lid on the selected instrument block • Close Lid. Close a motorized lid on the selected instrument block • Rename.
CFX96 Touch, CFX96 Touch Deep Well, CFX Connect, and CFX384 Touch Systems Instruction Manual If only one instrument is detected, the View Summary button does not appear. To view the Instrument Summary window for a single instrument, select View > Instrument Summary. Status Bar The left side of the status bar at the bottom of the main software window shows the current status of the instruments. View the right side of the status bar to see the current user name, date, and time.
CFX Manager™ Software • In the Instrument Properties tab, type a name in the Rename box at the top of the Properties tab and hit the Rename button to save the new name The Properties tab displays important serial numbers for the connected instrument, including the thermal cycler and reaction module. The firmware versions are also displayed. Shipping Screw Tab The Shipping Screw tab includes instructions for installing or removing the red shipping screw.
CFX96 Touch, CFX96 Touch Deep Well, CFX Connect, and CFX384 Touch Systems Instruction Manual Calibrated Dyes Tab Open the Calibrated Dyes tab (Figure 14) to view the calibrated fluorophores and plates for the selected instrument. Click an Info button to see detailed information about a calibration. Figure 14. Calibrated Dyes tab in the Instrument Properties window.
CFX Manager™ Software Master Mix Calculator To open the Master Mix Calculator, click the Master Mix Calculator button in the toolbar (Table 9) or select Tools > Master Mix Calculator from the main window. Figure 15. Master Mix Calculator window. To set up a reaction master mix: 1. Select either SYBR® Green/EvaGreen or Probes detection method. 2.
CFX96 Touch, CFX96 Touch Deep Well, CFX Connect, and CFX384 Touch Systems Instruction Manual WARNING! Removing a target from the target list also removes it from any master mixes calculations it is used in. 5. Adjust the Supermix Concentration, Reaction Volume Per Well, Excess Reaction Volume, template volume that will be added to each well, and the Number of Reactions that will be run. 6.
CFX Manager™ Software To Set up the Scheduler 1. The first time Scheduler is opened, any User, Instrument, and SMTP email settings will be imported from CFX Manager software. 2. To add a new instrument, select View > Instrument Details or click the Manage Instruments button below the Instruments list (Figure 16) in the scheduler main window. In the Instrument Details window, enter the instrument name in the Name column.
CFX96 Touch, CFX96 Touch Deep Well, CFX Connect, and CFX384 Touch Systems Instruction Manual Table 10. Menu bar items in the Scheduler.
CFX Manager™ Software Figure 18. Scheduler New Event window. Cleanup events Select Tools > Cleanup Events to delete events from the calendar older than the period of time specified in the Scheduler Options window (Figure 19). WARNING! All events older than the specified date will be deleted. Scheduler Options Select Tools > Options to define Scheduler display, cleanup, and launch settings. Click Restore Defaults to restore the Scheduler default settings. Figure 19. Scheduler Options window.
CFX96 Touch, CFX96 Touch Deep Well, CFX Connect, and CFX384 Touch Systems Instruction Manual 3 Performing Runs Read this chapter for information about performing runs using CFX Manager™ software: • Run Setup window (page 27) • PrimePCR™ runs (page 28) • Protocol tab (page 29) • Plate tab (page 29) • Start Run tab (page 30) • Run Details window (page 31) • Instrument Summary window (page 34) Run Setup Window The Run Setup window provides quick access to the files and settings needed to set up and start a
Performing Runs The Run Setup window opens with the Protocol tab in front (Figure 20). To open another tab, click that tab or click the Prev or Next button at the bottom of the window. Figure 20. Run Setup window, including the Protocol, Plate, and Start Run tabs. PrimePCR Runs PrimePCR runs use pathway or disease-specific assays that have been wet-lab validated and optimized and are available from Bio-Rad in the following formats: • Pre-plated panels.
CFX96 Touch, CFX96 Touch Deep Well, CFX Connect, and CFX384 Touch Systems Instruction Manual To import target information for PrimePCR plates into a run’s plate layout select Plate Setup > Apply PrimePCR File from the Real-time Status tab (page 33) or Data Analysis window (page 71) and choose the appropriate file (.csv).
Performing Runs • Edit Selected button. Open the currently selected plate in the Plate Editor Figure 21. Plate tab window. Start Run Tab The Start Run tab (Figure 22) includes a section for checking information about the run that is going to be started, including the selected protocol and plate files, and a section for selecting the instrument block. • Run Information pane. View the selected Protocol file, Plate file, and data acquisition Scan Mode setting.
CFX96 Touch, CFX96 Touch Deep Well, CFX Connect, and CFX384 Touch Systems Instruction Manual Figure 22. Start Run tab. NOTE: You can override the Sample Volume loaded in the Protocol file by selecting the volume in the spreadsheet cell and typing a new volume. NOTE: A run ID can be entered for each block by selecting the cell and typing an ID or by selecting the cell and scanning with a bar code reader.
Performing Runs Figure 23 shows the features of the Run Details window. Figure 23. Run Details window showing the Run Status tab. Run Status Tab The Run Status tab (Figure 23) shows the current status of a run in progress in the Run Details window and provides buttons (below) to control the lid and change the run in progress. • Run Status pane. Displays the current progress of the protocol • Run Status buttons.
CFX96 Touch, CFX96 Touch Deep Well, CFX Connect, and CFX384 Touch Systems Instruction Manual Table 11. Run Status buttons and their functions. (continued) Button Function Skip the current step in the protocol. If you skip a GOTO step, the software verifies that you want to skip the entire GOTO loop and proceed to the next step in the protocol Flash the LED on the selected instrument to identify the selected blocks Pause the protocol NOTE: This action is recorded in the Run Log.
Performing Runs Editing a Plate Setup The plate setup can be viewed and edited while a run is in progress by selecting View/Edit Plate from the Plate Setup drop-down in the Real-time Status tab (Figure 24). The Plate Editor window will then be presented and edits can be made as outlined in Chapter 5 (Plates). NOTE: The trace styles can also be edited from the Plate Editor window and any changes made will be visible in the amplification trace plot in the Real-time Status tab.
CFX96 Touch, CFX96 Touch Deep Well, CFX Connect, and CFX384 Touch Systems Instruction Manual Instrument Summary Toolbar The Instrument Summary toolbar includes the buttons and functions listed in Table 12. Table 12. Toolbar buttons in the Instrument Summary window.
Performing Runs 36
CFX96 Touch, CFX96 Touch Deep Well, CFX Connect, and CFX384 Touch Systems Instruction Manual 4 Protocols Read the following chapter for information about creating and editing protocol files: • Protocol Editor window (page 37) • Protocol Editor controls (page 39) • Temperature control mode (page 42) • Protocol AutoWriter (page 43) Protocol Editor Window A protocol instructs the instrument to control the temperature steps, lid temperature, and other instrument options.
Protocols • Protocol Editor buttons. Edit the protocol by clicking one of the buttons to the left of the text view Figure 26. Protocol Editor window with buttons for editing protocols. Protocol Editor Menu Bar The menu bar in the Protocol Editor window provides the menu items listed in Table 13. Table 13. Protocol Editor menu bar.
CFX96 Touch, CFX96 Touch Deep Well, CFX Connect, and CFX384 Touch Systems Instruction Manual Table 14 lists the functions of the Protocol Editor toolbar buttons. Table 14. Protocol Editor toolbar buttons.
Protocols 2. Click the Add Plate Read to Step button to add a plate read to the selected step. If the step already contains a plate read, the text on the button changes so that the same button reads Remove Plate Read. Click to remove a plate read from the selected step. Insert Gradient Button To insert a gradient step before or after the currently selected step: 1. Insert a temperature gradient step by clicking the Insert Gradient button. 2.
CFX96 Touch, CFX96 Touch Deep Well, CFX Connect, and CFX384 Touch Systems Instruction Manual 2. Edit the GOTO step number or number of GOTO repeats by clicking the default number in the graphic or text view and entering a new value. Figure 27 shows an inserted GOTO step at the end of the protocol. Notice that the GOTO loop includes steps 2 through 4. Insert Melt Curve Button To insert a melt curve step before or after the selected step: 1. Click the Insert Melt Curve button. 2.
Protocols Figure 29 shows the selected step with a gradient of 10oC. Notice that some options are not available in a gradient step. A gradient step cannot include an increment or ramp rate change. Figure 29. Step option for a gradient. NOTE: A gradient runs with the lowest temperature in the front of the block (row H) and the highest temperature in the back of the block (row A). The Step Options window lists the following options you can add or remove from steps: • Plate Read.
CFX96 Touch, CFX96 Touch Deep Well, CFX Connect, and CFX384 Touch Systems Instruction Manual • Calculated mode. When you enter a sample volume between 1 and 50 μl (96-well block) or between 1 and 30 μl (384-well block) the thermal cycler calculates the sample temperature based on the sample volume. This is the standard mode • Block mode.
Protocols 3. Select an enzyme type from the list of options (iTaq™ DNA polymerase, iProof™ DNA polymerase, or Other). 4. Add parameters in the Additional Parameters (Optional) pane if you want to add a Gradient Range, Hot Start Activation temperature, or Final Extension time in the protocol. 5. Select a protocol speed (Standard, Fast, or Ultrafast) by moving the sliding bar in the Type pane. When you move the sliding bar, the software adjusts the total run time.
CFX96 Touch, CFX96 Touch Deep Well, CFX Connect, and CFX384 Touch Systems Instruction Manual 5 Plates Read this chapter for information about creating and editing plate files: • Plate Editor window (page 45) • Setup Wizard (page 48) • Select Fluorophores window (page 50) • Well loading controls (page 51) • Experiment Settings window (page 53) • Well selector right-click menu items (page 55) • Well Groups Manager window (page 56) • Plate Spreadsheet View/Importer window (page 57) Plate Editor Window A pla
Plates Figure 31. Plate Editor window. Plate Editor Menu Bar The menu bar in the Plate Editor window provides the menu items shown in Table 15. Table 15. Plate Editor menu bar. Menu Item File Settings 46 Command Function Save Save the plate files Save As Save the plate file with a new file name Close Close the Plate Editor Plate Size Select a plate size that reflects the number of wells in the instrument block.
CFX96 Touch, CFX96 Touch Deep Well, CFX Connect, and CFX384 Touch Systems Instruction Manual Table 15. Plate Editor menu bar. (continued) Menu Item Command Function Units Select the units to show in the spreadsheets when performing quantification of unknowns vs.
Plates Plate Size and Type The software applies these plate settings to all the wells during the run: • Plate Size. Select a plate size that represents the size of the reaction module block of your instrument. Choosing the instrument type (CFX96, CFX96 Deep Well, CFX Connect, or CFX384 instrument) from the pull-down menu option on the Startup Wizard will change the default plate size loaded in the Plate tab of the Run Settings window.
CFX96 Touch, CFX96 Touch Deep Well, CFX Connect, and CFX384 Touch Systems Instruction Manual The Wizard (Figure 32) can be opened by selecting Editing Tools > Setup Wizard from the Plate Editor window menu bar. Figure 32. Auto layout tab of Setup Wizard. Create a plate layout by following these steps: 1. Auto layout tab. Select the area in which samples will be located on the plate by clicking on a well at one edge and then dragging to encompass the area required.
Plates 5. Control sample tab. Click on one sample to use as a control for relative gene expression calculations. 6. Click OK to apply the information entered to your plate. Any additional edits can be made using the Plate Editor. NOTE: Returning to the Auto layout tab will reset the plate layout. The layout can also be reset by selecting Tools > Clear Plate. TIP: To read text within wells of the plate layout more easily, click the Zoom plate box for a magnified view.
CFX96 Touch, CFX96 Touch Deep Well, CFX Connect, and CFX384 Touch Systems Instruction Manual Well Loading Controls A plate file contains information about the contents of each well loaded with sample for a run. After the run, the software links the well contents to the fluorescence data collected during the protocol and applies the appropriate analysis in the Data Analysis window. For example, wells loaded with standard sample type are used to generate a standard curve.
Plates Table 17. Options for loading the plate and wells in the Plate Editor. (continued) Option Function For gene expression analysis or to distinguish among multiple samples, select a Sample Name from the pulldown menu to load that sample name in the selected wells. To delete a sample name, select it in the menu, press the Delete key, and then press Enter TIP: To add a new sample name to the pull-down menu in the current plate, type a new name in the pull-down box and press the Enter key.
CFX96 Touch, CFX96 Touch Deep Well, CFX Connect, and CFX384 Touch Systems Instruction Manual Table 17. Options for loading the plate and wells in the Plate Editor. (continued) Option Function Click the Dilution Series button to enter a dilution series for the concentration of Standard samples, and load a standard curve.
Plates Open the Experiment Settings window to view or change the list of Targets and Samples (Figure 34) or to set the gene expression analysis sample group to be analyzed if Biological Set Names have been added to the wells. • Targets. A list of target names for each PCR reaction, such as a genes or sequences of interest. Click the Reference column to assign reference genes in a run • Samples.
CFX96 Touch, CFX96 Touch Deep Well, CFX Connect, and CFX384 Touch Systems Instruction Manual • Select the target as a reference for gene expression data analysis by clicking the box in the Reference column next to the name for that target • Select the sample as a control sample for gene expression data analysis by clicking the box in the Control column next to the name for that sample Click the Show Analysis Settings box in the Experiment Settings window to view or change analysis parameters applied in the
Plates Well Groups Manager Window Well groups divide a single plate into subsets of wells that can be analyzed independently in the Data Analysis window. Once well groups are set up, select one in the Data Analysis window to analyze the data as an independent group. For example, set up well groups to analyze multiple experiments run in one plate or to analyze each well group with a different standard curve. NOTE: The default well group is All Wells.
CFX96 Touch, CFX96 Touch Deep Well, CFX Connect, and CFX384 Touch Systems Instruction Manual Plate Spreadsheet View/Importer Window The Plate Spreadsheet View window shows the contents of a plate in the Plate Editor. Open the Plate Spreadsheet View window (Figure 37) by clicking the Spreadsheet View/Importer button on the Plate Editor Toolbar. Figure 37. Plate Spreadsheet View window. Open the spreadsheet view to import or export the well contents to Excel or to another tabdelimited format.
Plates • Export to Excel. Export the file to an Excel spreadsheet • Export to Text. Export the file as a text file • Export to Xml. Export the file as a .xml file • Export to Html. Export the file as a .html file • Find. Find text in the spreadsheet • Sort.
CFX96 Touch, CFX96 Touch Deep Well, CFX Connect, and CFX384 Touch Systems Instruction Manual 6 Stand-Alone Operation Read this chapter for information about running the CFX96 Touch™ system, CFX96 Touch Deep Well™ system, or CFX384 Touch™ system in stand-alone mode: • Home screen (page 60) • Run setup (page 60) • Exporting data for analysis (page 66) • Creating a data file (page 67) • Setting Up email (page 67) NOTE: If you are using a C1000™ base, please contact technical support to obtain a pdf version o
Stand-Alone Operation Home Screen At startup, the CFX96 Touch system, CFX96 Touch Deep Well system, and CFX384 Touch system runs a self-test to verify proper functions and then displays the home screen. Use the home screen to begin to operate the instrument. The home screen provides access to all system operations and displays the date and time, the name of a logged-in user, the system status, thermal cycler name (defaults to serial number), and any attached S1000™ thermal cyclers (Figure 38).
CFX96 Touch, CFX96 Touch Deep Well, CFX Connect, and CFX384 Touch Systems Instruction Manual To Create a New Protocol: 1. Select New Protocol on the home screen to open a new protocol template (Figure 39). Figure 39. Default real-time PCR protocol. NOTE: By default, the protocol template contains a plate read step when a CFX96™, CFX96 Deep Well™, or CFX384™ optical reaction module is inserted in the C1000 Touch thermal cycler chassis. 2.
Stand-Alone Operation include the temperature, time, gradient, ramp rate, increment, extension, and add/ remove a plate read (Figure 40). Figure 40. Step Options window. NOTE: A gradient ranging from 1–24oC can be entered. Once a step has a gradient, you can edit the gradient temperature by selecting the upper and lower temperature buttons in the graphic view without opening the Step Options screen. 5.
CFX96 Touch, CFX96 Touch Deep Well, CFX Connect, and CFX384 Touch Systems Instruction Manual Figure 41. Save As window. Running the Protocol 1. To run the protocol, touch the Run button in the Edit Protocol window (Figure 39). 2. Verify the lid temperature (Lid Temp), sample volume (Volume), and file name (File Name (.zpcr)) that will be used for the run (Figure 42). A default stand-alone data file name is created prior to the run. Figure 42. Run confirmation screen. 3.
Stand-Alone Operation Running a Previously Saved Protocol • To run an existing protocol, select Saved Files from the home screen. After selecting the location, folder, and file, touch the Run button (Figure 43). Figure 43. Selecting a saved protocol to run. • To change the cycling parameters for an existing protocol, select it and then touch the Edit button. The protocol can be run immediately without saving the changes by touching the Run button, or it can be saved by touching the Save button.
CFX96 Touch, CFX96 Touch Deep Well, CFX Connect, and CFX384 Touch Systems Instruction Manual screen at a time. If a protocol includes multiple data collection steps, data from an individual step can be displayed by choosing it from the Step drop-down menu. Figure 45. View real-time data traces on the Curves screen. To display traces for specific wells of interest, touch the Select Wells button. Selected wells are indicated by solid circles. The default setting is all wells selected.
Stand-Alone Operation Exporting Data for Analysis When the run is complete, the fluorescence data need to be transferred to a computer running CFX Manager software for analysis. The stand-alone data file (.zpcrd) is automatically saved to the Real-Time Data folder in the Location column of the Saved Files window. NOTE: The C1000 Touch thermal cycler stores up to 100 real-time PCR runs.
CFX96 Touch, CFX96 Touch Deep Well, CFX Connect, and CFX384 Touch Systems Instruction Manual Creating a Data File Stand-alone run data (.zpcr) must be converted to a data file (.pcrd) by CFX Manager software to be analyzed. Follow these instructions to create a data file from a stand-alone run: 1. Click and drag the .zpcr file from the USB flash drive directory over the main software window or Select File > Open > Stand-alone Run from the main software window menu options to select the file name. 2.
Stand-Alone Operation Figure 48. Gmail server is selected, user name and password have been entered, and this server has been selected as the default server for email communications. 4. Touch the Save button to save the current server settings. 5. Touch the Test Email button. 6. Touch the Test Email Address field and enter an email address using the pop-up alphanumeric keypad. 7. Touch the Attachment Size in MB field and enter a test attachment size.
CFX96 Touch, CFX96 Touch Deep Well, CFX Connect, and CFX384 Touch Systems Instruction Manual Removing a Server 1. Select the server to be removed from the Mail Servers drop-down list. 2. Touch the Remove Server button. 3. Touch the Yes button to confirm removal of selected server.
Stand-Alone Operation 70
CFX96 Touch, CFX96 Touch Deep Well, CFX Connect, and CFX384 Touch Systems Instruction Manual 7 Data Analysis Overview Read this chapter for information about data analysis: • Data Analysis window (page 71) • Quantification tab (page 74) • Data analysis settings (page 75) • Well selectors (page 78) • Charts (page 81) • Spreadsheets (page 82) • Export (page 83) Data Analysis Window During data analysis, changing the way the data are displayed by changing the contents of the wells in the Plate Editor never
Data Analysis Overview • Select File > Open > Data File in the main software window to select a file in the Windows browser • Click the Data Analysis button in the main software window toolbar to select a file in the Windows browser • Select File > Recent Data Files to select from a list of the ten most recently opened data files The Data Analysis window displays multiple tabs (Figure 49), each tab showing the analyzed data for a specific analysis method or run-specific information.
CFX96 Touch, CFX96 Touch Deep Well, CFX Connect, and CFX384 Touch Systems Instruction Manual Table 20. Menu bar items in the Data Analysis window.
Data Analysis Overview Table 20. Menu bar items in the Data Analysis window. (continued) Menu Item Tools Command Function Export to LIMS Folder... Open a window to save data in a predetermined format to the LIMS folder Reports... Open the Report for this data file Well Group Reports... Open the Well Group Report window to generate reports for specified well groups Import Fluorophore Calibration... Select a calibration file to apply to the current data file qbase+ Launch qbase+ v2.
CFX96 Touch, CFX96 Touch Deep Well, CFX Connect, and CFX384 Touch Systems Instruction Manual Step Number Selector The CFX96 Touch™, CFX96 Touch Deep Well™, CFX Connect™, and CFX384 Touch™ systems can acquire fluorescence data at multiple protocol steps; the software maintains the data acquired at each step independently. The software displays the Step Number selector below the Standard Curve chart on the Quantification tab whenever a protocol contains more than one data collection step.
Data Analysis Overview 2. Select Settings > Baseline Threshold... in the menu bar to open the Baseline Threshold window. 3. Adjust the crossing threshold (Figure 53) for the fluorophore by clicking User Defined and entering a threshold number. Figure 53. Baseline Threshold window. 4. Click OK to confirm the change and close the window. TIP: To have the same threshold value used for all of your data files define this in the Data Analysis tab of the User Preferences window.
CFX96 Touch, CFX96 Touch Deep Well, CFX Connect, and CFX384 Touch Systems Instruction Manual • Apply Fluorescent Drift Correction. For wells that have abnormally drifting RFU values during the initial few cycles of a run, the software derives an estimated baseline from adjacent wells for which a horizontal baseline was successfully generated Adjusting the Baseline Once wells for analysis have been selected, check the baseline settings in these wells.
Data Analysis Overview Figure 54. Fluorophore analysis mode selected. When Target is selected, data traces are displayed by target name as entered in the plate setup (Figure 55). Figure 55. Target analysis mode selected. Cycles to Analyze To restrict data analysis to a specified range of cycles, select Settings > Cycles to Analyze. Select the starting cycle and the ending cycle using the arrow buttons or by typing in the desired values and pressing Enter.
CFX96 Touch, CFX96 Touch Deep Well, CFX Connect, and CFX384 Touch Systems Instruction Manual • To hide multiple wells, click and drag across the wells you want to select. To show those wells, click and drag across the wells again • Click the top left corner of the plate to hide all the wells. Click the top left corner again to show all wells • Click the start of a column or row to hide those wells.
Data Analysis Overview Temporarily Exclude Wells from Analysis To exclude any wells from data analysis temporarily: USING RIGHT-CLICK 1. Right-click the well in the well selector, on a fluorescence trace, or on a point plotted on the standard curve. To exclude multiple wells, right-click and drag to highlight multiple wells, traces, or points. 2.
CFX96 Touch, CFX96 Touch Deep Well, CFX Connect, and CFX384 Touch Systems Instruction Manual Figure 58. Exclude Wells in Analysis checkbox at bottom of the pane. 4. The excluded wells are marked with an asterisk (*) in the Plate Editor window. Alternatively, to permanently remove wells from analysis, clear the contents from wells in the Plate Editor by clicking the Clear Wells button. WARNING! You will have to reenter any well content that is cleared.
Data Analysis Overview Charts can be copied into Microsoft Word or PowerPoint documents by clicking on the icon in the upper right corner of the pane, dragging, and then releasing at the required location. The image resolution will correspond to that of the screen from which the image was obtained. NOTE: Menu items that apply to specific charts are described in the next chapter, Data Analysis Windows (page 85).
CFX96 Touch, CFX96 Touch Deep Well, CFX Connect, and CFX384 Touch Systems Instruction Manual Export Four export options are accessible from the Export drop-down menu. Export All Data Sheets to Excel Select Export > Export All Data Sheets to Excel to export all the spreadsheet views from every tab of CFX Manager software into individual Excel files. Export RDML Files Select Export > Export RDML Files and choose either version 1.1 or 1.
Data Analysis Overview Figure 59. Custom Export window. 1. Select the export format from the following file export formats (Text *.txt, CSV *.csv, Excel 2007 *.xlsx, Excel 2003 *.xls, XML *.xml, and HTML *.html). 2. Select the items to be exported by checking the appropriate checkboxes. 3. Click the Customize Column Names button to change column names. 4. Click the Export button to open a Save As window to specify the file name and location for the exported file.
CFX96 Touch, CFX96 Touch Deep Well, CFX Connect, and CFX384 Touch Systems Instruction Manual 8 Data Analysis Windows Read this chapter for more information about the tabs in the Data Analysis window: • Quantification tab (page 85) • Quantification Data tab (page 89) • Melt Curve tab (page 92) • Melt Curve Data tab (page 93) • End Point tab (page 96) • Allelic Discrimination tab (page 98) • Custom Data View tab (page 100) • QC tab (page 101) • Run Information tab (page 102) • Data file reports (page 103) •
Data Analysis Windows Figure 60. Layout for the Quantification tab in the Data Analysis window. Fluorophore Selector To select the fluorophore data to display in the Quantification tab charts and spreadsheets, click the fluorophore selector below the Amplification chart. Click the box next to the fluorophore name to show or hide the fluorophore data throughout the data analysis window.
CFX96 Touch, CFX96 Touch Deep Well, CFX Connect, and CFX384 Touch Systems Instruction Manual Figure 61. Trace Styles window. Use the tools in the Trace Styles window to adjust appearance of traces and preview the changes in the well selector at the bottom of the window. • Select a specific set of wells by using the well selector.
Data Analysis Windows Standard Curve Chart The software creates a Standard Curve chart (Figure 63) in the Quantification tab if the data include sample types defined as standard (Std) for one fluorophore in the run. Figure 63. Standard Curve chart. The Standard Curve chart displays the following information: • Name for each curve (the fluorophore or target) • Color of each fluorophore or target • Reaction efficiency (E).
CFX96 Touch, CFX96 Touch Deep Well, CFX Connect, and CFX384 Touch Systems Instruction Manual Trace Styles... Open the Trace Styles window to change trace styles that appear on the Quantification and Melt Curve tabs Baseline Thresholds...
Data Analysis Windows Results Spreadsheet Select a Results spreadsheet (Figure 64) to see data for each well in the plate. Figure 64. Quantification Data tab with Results spreadsheet selected. NOTE: All Std. Dev (standard deviation) calculations apply to the replicate groups assigned in the wells in the Plate Editor window. The calculations average the Cq value for each well in the replicate group. The Results spreadsheet includes the types of information listed in Table 26. Table 26.
CFX96 Touch, CFX96 Touch Deep Well, CFX Connect, and CFX384 Touch Systems Instruction Manual Figure 65. Standard Curve Results spreadsheet in the Quantification Data tab. These values can be copied and pasted into a document by right-clicking and selecting Copy or a file can be created by choosing one of the Export options. Table 27. Standard Curve Results spreadsheet contents.
Data Analysis Windows RFU Spreadsheet Select the RFU spreadsheet to see the relative fluorescence units (RFU) readings for each well acquired at each cycle of the run. Select individual fluorophores by clicking a tab at the bottom of the spreadsheet. The well number appears at the top of each column and the cycle number appears to the left of each row (Figure 67). Figure 67. RFU spreadsheet in the Quantification Data tab.
CFX96 Touch, CFX96 Touch Deep Well, CFX Connect, and CFX384 Touch Systems Instruction Manual Figure 68. Layout of the Melt Curve tab in the Data Analysis window.
Data Analysis Windows Melt Peaks Spreadsheet Select the Melt Peaks spreadsheet (Figure 69) to view melt curve data. Figure 69. Melt Peaks spreadsheet in the Melt Curve Data tab. The Melt Peaks spreadsheet (Figure 69) includes the types of information shown in Table 28. Table 28. Melt Peaks spreadsheet content.
CFX96 Touch, CFX96 Touch Deep Well, CFX Connect, and CFX384 Touch Systems Instruction Manual Plate Spreadsheet Select the Plate spreadsheet (Figure 70) to view melt curve data in a plate format. Figure 70. Plate spreadsheet in the Melt Curve Data tab. NOTE: To adjust the peak that the software calls, adjust the threshold line in the Melt Peak chart on the Melt Curve tab. The Plate spreadsheet includes the types of information shown in Table 29. Table 29. Plate spreadsheet content.
Data Analysis Windows Table 30 lists the types of information shown in the RFU spreadsheet. Table 30. RFU spreadsheet content. Information Description Well number (A1, A2, A3, A4, Well position in the plate for the loaded wells A5...) Temperature Melting temperature of the amplified target. Plotted as one well per row and multiple wells for multiple products in the same well -d(RFU)/dT Spreadsheet Select the -d(RFU)/dT spreadsheet to view the types of data shown in Figure 72. Figure 72.
CFX96 Touch, CFX96 Touch Deep Well, CFX Connect, and CFX384 Touch Systems Instruction Manual The End Point tab shows the average RFU values to determine whether or not the target was amplified by the last (end) cycle. Use these data to determine if a specific target sequence is present (positive) in a sample. Positive targets have higher RFU values than the cutoff level you define. TIP: To create an end point protocol, open the Protocol tab (Run Setup window) and select Options > End Point Only Run.
Data Analysis Windows Adjusting the End Point Data Analysis Adjust the information shown in the End Point tab by using these methods: • Choose a Fluorophore from the pull-down list to view the data • Choose an End Cycle to Average value to set the number of cycles that the software uses to calculate the average end point RFU • Select RFUs to view the data in relative fluorescence units • Select Percentage of Range to view the data as a percentage of the RFU range • Select wells in the well selector to focu
CFX96 Touch, CFX96 Touch Deep Well, CFX Connect, and CFX384 Touch Systems Instruction Manual • Well spreadsheet. Shows a spreadsheet listing the allelic discrimination data collected in the selected wells • Setting Panel. Allows changes to x and y axis label in the Allelic Discrimination chart, selection of the cycle for analysis, and selection to display call map Figure 74. Layout of the Allelic Discrimination tab in the Data Analysis window.
Data Analysis Windows Chart Menu Options In addition to the common right-click menu options to copy, print, and export charts (see Table 22), Table 33 lists the menu options available on the Allelic Discrimination chart. Table 33. Allelic Discrmination chart right-click (and drag) and left-click (and drag) menu options.
CFX96 Touch, CFX96 Touch Deep Well, CFX Connect, and CFX384 Touch Systems Instruction Manual Customized views can be saved as new preset templates by clicking Save as Preset. Existing presets can be deleted, renamed, or the default preset views restored using Manage Presets. Figure 75. Custom Data View tab. QC Tab Open the QC tab to quickly assess the quality of the run data based on the rules defined in the QC tab in the User Preferences window (see QC Tab on page 140 for more information).
Data Analysis Windows • QC Rule Summary. Shows the selected QC rule and highlights wells that fail the rule Figure 76. QC tab layout. Excluding Wells that Fail QC Wells failing QC criteria are listed in the results column of the QC rules table and in the summary pane. These wells can be excluded or included in analysis by checking or unchecking the appropriate Exclude Wells checkbox. Run Information Tab The Run Information tab (Figure 77) shows the protocol and other information about each run.
CFX96 Touch, CFX96 Touch Deep Well, CFX Connect, and CFX384 Touch Systems Instruction Manual Figure 77. Run Information tab layout. Data File Reports The Report window (Figure 78) shows information about the current data file in the Data Analysis window. To open a report, select Tools > Reports or click the Reports button on the toolbar in the Data Analysis window. The Report window shows these three sections: • Menu and toolbar.
Data Analysis Windows Figure 78. Example of a Report window for a data file. TIP: The layout of a report can define the type of information that appears in it if you save the report as a template. Select Template > Save or Save As to save the layout of the current report as a template. Create a Data Analysis Report To create a report in the Data Analysis window, follow these steps: 1.
CFX96 Touch, CFX96 Touch Deep Well, CFX Connect, and CFX384 Touch Systems Instruction Manual 7. (Optional) Create a report template with the information you want. To save the current report settings in a template, select Template > Save or Save As. Then load the report template the next time you want to make a new report. Data Analysis Report Categories A report can include any of the options in each category described in Table 35, depending on the type of data in Data Analysis window. Table 35.
Data Analysis Windows Table 35. Data analysis report categories in the options list.
CFX96 Touch, CFX96 Touch Deep Well, CFX Connect, and CFX384 Touch Systems Instruction Manual 2. From the Well Groups Reports window (Figure 79) the Well Groups, Amplification Steps, and Melt Steps to be included in the reports can be specified by checking the appropriate box. 3. The destination folder can be changed to another location by clicking the ... button. 4. Select Choose a Report Template to choose a template other the default. Click the ... button to browse for the template file. 5.
Data Analysis Windows 108
CFX96 Touch, CFX96 Touch Deep Well, CFX Connect, and CFX384 Touch Systems Instruction Manual 9 Gene Expression Analysis Read this chapter for information about performing Gene Expression Analysis: • Gene Expression (page 109) • Plate setup for gene expression analysis (page 110) • Guided plate setup (page 110) • Bar Chart (page 111) • Clustergram (page 118) • Scatter Plot (page 119) • Volcano Plot (page 120) • Heat Map (page 121) • Results (page 121) • Gene Study (page 122) • Gene Study Report window (pag
Gene Expression Analysis • Relative expression level of one target sequence in one sample compared to the same target under different sample treatments. For example, the relative amount of one gene relative to itself under different temporal, geographical, or developmental conditions Plate Setup for Gene Expression Analysis To perform gene expression analysis, the contents of the wells must include the following: • Two or more targets.
CFX96 Touch, CFX96 Touch Deep Well, CFX Connect, and CFX384 Touch Systems Instruction Manual • Replace Plate File. Select a plate layout file that was previously created • Replace PrimePCR File. Select a PrimePCRTM run file from which to apply the plate layout information 2. Select Reference Targets and Control Sample using • Experiment Settings.
Gene Expression Analysis To set up normalized gene expression (ΔΔCq) analysis, follow these steps: 1. Open a data file (.pcrd extension). 2. Review the data in the Quantification tab of the Data Analysis window. Make adjustments to the data, such as changing the threshold and the Analysis Mode. 3. Click the Gene Expression tab. 4. Choose a control in the Samples tab of the Experiment Settings window.
CFX96 Touch, CFX96 Touch Deep Well, CFX Connect, and CFX384 Touch Systems Instruction Manual CHART SETTINGS The following options are revealed when the Show Chart Settings box is checked: X-Axis Options, Y-Axis Options, Scaling, Error Type, and Chart Error Bar Multiplier. X-AXIS OPTIONS The x-axis option allows you to select the x-axis data of the Gene Expression chart: • Target. Select this option to graph the target names on the x-axis • Sample.
Gene Expression Analysis • Coefficient of variation (CV) of normalized reference gene relative quantities. A lower CV value denotes higher stability • M-value. A measure of the reference gene expression stability Table 36. Acceptable values for stably expressed reference genes. (Hellemans et al. 2007) Samples CV M Homogeneous <0.25 <0.5 Heterogeneous <0.5 <1 Right-Click Menu Options Right-click on the bar chart to select the items shown in Table 37. Table 37. Right-click menu items.
CFX96 Touch, CFX96 Touch Deep Well, CFX Connect, and CFX384 Touch Systems Instruction Manual Table 38. Description of information in the spreadsheet on the Bar Chart tab.
Gene Expression Analysis Experiment Settings Window Open the Experiment Settings window by clicking the Experiment Settings button in the Bar Chart tab. In this window, view or change the list of Targets and Samples, select reference genes, select control samples, or set the Gene Expression Analysis sample group to be analyzed if Biological Set Names have been added to the wells (Figure 83). Figure 83. Experiment Settings window with Targets tab selected.
CFX96 Touch, CFX96 Touch Deep Well, CFX Connect, and CFX384 Touch Systems Instruction Manual SHOW ANALYSIS SETTINGS IN EXPERIMENT SETTINGS Click the Show Analysis Settings box in the Experiment Settings window to view or change analysis parameters applied in the Bar Chart tab: • Click a cell in the Color column to change the color of the targets graphed in the Gene Expression chart • Enter a number for the efficiency of a target.
Gene Expression Analysis Figure 85 shows the samples with the Show Chart option selected. Figure 85. Samples tab in the Experiment Settings window with Analysis Settings selected. Clustergram A clustergram shows the data in a hierarchy based on the degree of similarity of expression for different targets and samples. NOTE: A reference target needs to be selected to display any of the data plots other than relative expression for bar charts.
CFX96 Touch, CFX96 Touch Deep Well, CFX Connect, and CFX384 Touch Systems Instruction Manual Right-Click Menu Options Right-click on the clustergram to select the items shown in Table 40. Table 40. Right-click menu items. Item Function Copy Copy the chart to a clipboard Save Image As... Save the graph in the chart view as an image file. The file type options are PNG, GIF, JPG, TIF, or BMP. The image resolution will be the same as the computer display Print...
Gene Expression Analysis Table 41. Right-click menu items. Item Function Copy Copy the chart to a clipboard Save Image As... Save the graph in the chart view as an image file. Set the resolution and dimensions of the image and then select the file type (PNG, GIF, JPG, TIF, or BMP) Page Setup... Select a page setup for printing Print... Print the chart view Set Scale to Default Set the chart view back to the default settings after it’s been magnified Chart Options...
CFX96 Touch, CFX96 Touch Deep Well, CFX Connect, and CFX384 Touch Systems Instruction Manual Data Spreadsheet The spreadsheet lists the target, sample, regulation, P value, and whether the P value exceeds the threshold, and it indicates up- or downregulation compared to the threshold setting. Click the checkbox adjacent to a target to include or exclude it from the plot. Select chart options by right-clicking.
Gene Expression Analysis Table 42. Information in the Results tab. Information Description Target Target name (amplified gene) Sample Sample name Mean Cq Mean of the quantification cycle Mean Efficiency Corrected Cq Mean of the quantification cycle after adjusting for the reaction efficiency Normalized Expression Target expression normalized to a reference target (ΔΔCq) Relative Normalized Expression Normalized expression relative to a control sample.
CFX96 Touch, CFX96 Touch Deep Well, CFX Connect, and CFX384 Touch Systems Instruction Manual 2. Entire study: one inter-run calibrator is selected by the user and applied to the entire gene study. For more information, please contact Technical Support (phone numbers on back cover). Gene Study Window The Gene Study window includes two tabs: • Study Setup tab. Click this tab to manage the runs in the Gene Study.
Gene Expression Analysis The Study Setup tab lists the data files in the Gene Study, as described in Table 43. Table 43. Study Setup tab in the Gene Study window. Column Title Description File Name Name of the run data file (.
CFX96 Touch, CFX96 Touch Deep Well, CFX Connect, and CFX384 Touch Systems Instruction Manual Table 44. Categories for a Gene Study report.
Gene Expression Analysis location to store the file. Select File > Save As to save the report with a new name or in a new location. 7. Create a report template once you create a report with the content you want to include in all reports. To create a template, select Template > Save or Save As and save the current report as a template. Gene Expression Calculations CFX Manager™ software calculates formulas automatically and displays the resulting information in the Data Analysis tabs.
CFX96 Touch, CFX96 Touch Deep Well, CFX Connect, and CFX384 Touch Systems Instruction Manual Where: • E = Efficiency of primer and probe set. This efficiency is calculated with the formula (% Efficiency * 0.
Gene Expression Analysis Normalization Factor The denominator of the normalized expression equation is referred to as the normalization factor.
CFX96 Touch, CFX96 Touch Deep Well, CFX Connect, and CFX384 Touch Systems Instruction Manual Standard Deviation for the Normalized Expression Re-scaling the normalized expression value is accomplished by dividing the standard deviation of the normalized expression by the normalized expression value for the highest or lowest individual expression levels, depending on the Scaling Option you choose.
Gene Expression Analysis Normalized Expression Scaled to Lowest Expression Level When the run does not include controls, scale the normalized expression (NE) for each target (gene) by dividing the expression level of each sample by the lowest level of expression in all the samples. The software sets the lowest level of expression to a value of 1 and rescales all the sample expression levels.
CFX96 Touch, CFX96 Touch Deep Well, CFX Connect, and CFX384 Touch Systems Instruction Manual Regulation Regulation is a measure of the increase or decrease in the expression of a target for an experimental versus a control sample and is determined as follows: For RNE ≥ 1, Regulation = RNE For RNE < 1, Regulation = ( – 1 ) ⁄ RNE Where: • RNE = Relative normalized expression; this is the same as normalized expression when a control is selected P-Value The p-value is a measure of the statistical significanc
Gene Expression Analysis Corrected Values Formulas A difference between corrected values and noncorrected values is seen only if a standard curve is created as part of the real-time PCR run.
CFX96 Touch, CFX96 Touch Deep Well, CFX Connect, and CFX384 Touch Systems Instruction Manual 10 Users and Preferences Read this chapter to learn more about managing software users and their preferences: • Log in or Select User (page 133) • User Preferences window (page 134) • User Administration (page 142) Log in or Select User CFX Manager™ software manages multiple users and their preferences. The current, logged in software user is displayed at the top of the main software window.
Users and Preferences Change a Password Change a password by following these steps: 1. Select User > Change Password from the main software window menu to open the Change Password dialog box (Figure 89). 2. Enter the old password in the Old Password box. 3. Enter the new password in the New Password and the Confirm New Password boxes, respectively. 4. Click OK to confirm the change. Figure 89. The Change Password dialog box.
CFX96 Touch, CFX96 Touch Deep Well, CFX Connect, and CFX384 Touch Systems Instruction Manual TIP: Click the Restore Defaults button to restore all settings to the default settings shown in this image. Then click OK to save the settings and close the window. Email Tab Select the Email tab (Figure 90) to enter the email addresses where you want to receive confirmation of the completion of runs.
Users and Preferences attachments by checking the Test Attachment box and setting the Attachment Size in MB with up to 5 megabytes (MB) or more. Files Tab Select the Files tab (Figure 92) to list the default locations for opening and saving files. • Default Folder for File Creation. Select a default folder where you want to save new files. Select a location for each file type (Protocol, Plate, Data, or Gene Study file) • File Selection for Run Setup.
CFX96 Touch, CFX96 Touch Deep Well, CFX Connect, and CFX384 Touch Systems Instruction Manual polymerase, iTaq™ DNA polymerase, or other polymerases and the default amplicon length Figure 93. Protocol tab in the User Preferences window. Plate Tab Select the Plate tab in the User Preferences window (Figure 94) to specify the following default settings for a new Plate file in the Plate Editor window: • Plate Type. Select the default plate well type from the list • Plate Size.
Users and Preferences Figure 94. Plate tab in the User Preferences window. Data Analysis Tab Select the Data Analysis Tab in the User Preferences window (Figure 95) to change the default settings for data that appear in the Data Analysis window. Figure 95. Data Analysis tab in the User Preferences window. For analysis mode, select to analyze the data by either Fluorophore or Target.
CFX96 Touch, CFX96 Touch Deep Well, CFX Connect, and CFX384 Touch Systems Instruction Manual For quantification data, select the following settings: • Baseline Setting. Select the default baselining method for analysis mode. Choose Baseline Subtracted Curve Fit, No Baseline Subtraction, or Baseline Subtracted • Cq Determination Mode. Select between Regression mode or Single Threshold mode to determine how Cq values are calculated for each fluorescence trace • Threshold Calc. Mode.
Users and Preferences Specify the default settings for a new Gene Expression data file: • Relative to. Select a control or zero. To graph the gene expression data originating at 1 (relative to a control), select Control. When you assign a control sample in the Experiment Setup window, the software automatically defaults to calculate the data relative to that control.
CFX96 Touch, CFX96 Touch Deep Well, CFX Connect, and CFX384 Touch Systems Instruction Manual • NRT (no reverse transcriptase control) with a Cq less than xx. Input a Cq cutoff value • Positive control with a Cq greater than xx. Input a Cq cutoff value • Unknown without a Cq • Standard without a Cq • Efficiency greater than xx. Input a reaction efficiency cutoff value that is calculated for the standard curve • Efficiency less than xx.
Users and Preferences The ordering of the items selected can be changed by highlighting the item and then using the arrow buttons to the left of the Exported Columns list to move them up or down. NOTE: Selecting Restore Defaults from any of the User Preferences tabs restores the default factory settings for all user preferences options.
CFX96 Touch, CFX96 Touch Deep Well, CFX Connect, and CFX384 Touch Systems Instruction Manual 5. Click Yes to close the dialog box and window. To remove a software user, follow these steps: 1. In the Manage Users pane, click the box in the Delete list for each software user you want to remove. 2. Click OK to open a dialog box and confirm that you want to close the window. 3. Click Yes to close the dialog box and window. NOTE: The list of software users must always include one Administrator.
Users and Preferences 144
CFX96 Touch, CFX96 Touch Deep Well, CFX Connect, and CFX384 Touch Systems Instruction Manual 11 Resources Read this chapter to learn more about resources for the CFX96 Touch™, CFX96 Touch Deep Well™, CFX Connect™, or the CFX384 Touch™ system: • Automatic software and instrument updates (page 145) • Retrieving data files from thermal cycler base (page 146) • LIMS integration (page 146) • Calibration Wizard (page 151) • Instrument maintenance (page 153) • Application Log (page 155) • Troubleshooting (page 15
Resources When both software and instrument updates are selected, the software will update, restart, and then the instrument updates will begin. Instruments will need to be restarted once their updates have been completed. For the latest updates to be downloaded, the computer running CFX Manager software must be connected to the Internet. All data analysis windows must be closed and all instruments idle before updates can begin.
CFX96 Touch, CFX96 Touch Deep Well, CFX Connect, and CFX384 Touch Systems Instruction Manual Figure 100. Options window displaying the LIMS settings tab. 2. At run completion, a LIMS data export file can be automatically generated in addition to the CFX Manager software *.pcrd data file. Check the Automatically Export Data after Run (Figure 100) box to have the data exported automatically once a run is completed. 3.
Resources Creating a LIMS Protocol To start a LIMS run, a CFX Manager software protocol file (*.prcl) must be created and saved in the designated LIMS protocol folder location specified in the LIMS tab of the Options window. Creating a LIMS File A LIMS file (*.plrn) contains the plate setup details and the protocol file name. This file is generated by your internal LIMS.
CFX96 Touch, CFX96 Touch Deep Well, CFX Connect, and CFX384 Touch Systems Instruction Manual Table 45. Definition of LIMS .csv file contents.
Resources Table 45. Definition of LIMS .csv file contents. Column Row Description Y-AD Ch1 Well Color, Enter any user-defined trace style color Optional Ch2 Well Color, in a 32 bit integer (argb) decimal format Ch3 Well Color, Ch4 Well Color, Ch5 Well Color, FRET Well Color 14-110 Content Purpose Initiating a LIMS Run To initiate a LIMS run: 1. Open a LIMS file using one of the following methods: • Drag and drop the .
CFX96 Touch, CFX96 Touch Deep Well, CFX Connect, and CFX384 Touch Systems Instruction Manual When Automatically Export Data after Run is selected in LIMS Options, a second data file compatible with LIMS data retrieval will be saved to the same location. The file format and contents are defined using LIMS Data Export Format settings. To export this data manually, select Export > Export to LIMS Folder from the main software window menu bar.
Resources Figure 104 shows an example of the Dye Calibration window. Figure 104. Dye Calibration window. Calibrating the CFX96 Touch, CFX96 Touch Deep Well, CFX Connect, or CFX384 Touch System To calibrate the CFX96 Touch, CFX96 Touch Deep Well, CFX Connect, or CFX384 Touch system in the Dye Calibration window: 1. In the Calibrate New or Existing Fluorophores pane, select the fluorophore you want to calibrate from the pull-down list.
CFX96 Touch, CFX96 Touch Deep Well, CFX Connect, and CFX384 Touch Systems Instruction Manual 10.When CFX Manager software completes the calibration run, a dialog box appears. Click Yes to finish calibration and open the Dye Calibration Viewer. 11.Click OK to close the window.
Resources WARNING! To prevent electrical shock, always remove the reaction module from the thermal cycler base or unplug the base before cleaning the instrument. WARNING! Never touch or allow solutions to touch the optical system that is located behind the heated plate holes in the inner lid (Figure 105). Never touch anything behind these holes Block (96-well) Figure 105. Heating plate holes in the inner lid.
CFX96 Touch, CFX96 Touch Deep Well, CFX Connect, and CFX384 Touch Systems Instruction Manual WARNING! Bleach, ethanol, or soap that is left in the blocks could corrode the block and destroy plastics during a run. After cleaning, always rinse the wells thoroughly with water to remove all traces of cleaning reagents. WARNING! Never heat the block after adding a cleaning solution. Heating the block with cleaning solution will damage the block, reaction module, and thermal cycler base. • Clean the inner lid.
Resources 5. Touch the Recover Data button. A new data file (.zpcr) will be created and exported to the USB flash drive. NOTE: Only the last 5 run files can be recovered. Typically, software and instrument communication problems can be resolved by restarting your computer and the system. Be sure to save any work in progress before restarting. NOTE: Check that your computer has sufficient RAM and free hard drive space. The minimum RAM is 2 GB and the minimum hard drive space is 20 GB.
CFX96 Touch, CFX96 Touch Deep Well, CFX Connect, and CFX384 Touch Systems Instruction Manual the protocol continues only if the software is not shut down by the computer. When the computer and software start up again, the protocol continues If you want to open a locked motorized lid on a reaction module to remove your samples during a power failure, follow these steps to remove the locking plate: 1. Remove the reaction module from the C1000 Touch or CFX Connect chassis by pushing down on the locking bar.
Resources 5. Reassemble the reaction module with the lid open by replacing the locking latch and securing it with the large screws. Figure 109 shows the locking latch in place. Figure 109. Optical module locking latch. References Breslauer KJ et al. (1986). Predicting DNA duplex stability from the base sequence. Proc Nat Acad Sci 83, 3746–3750. Hellemans J et al. (2007). qBase relative quantification framework and software for management and automated analysis of real-time quantitative PCR data.
CFX96 Touch, CFX96 Touch Deep Well, CFX Connect, and CFX384 Touch Systems Instruction Manual Index Block, 3 Mode, 43 Button, 32 Clear Replicate #, 53 Clear Wells, 53 Close lid, 3, 32 Delete step, 42 Experiment Settings, 53 Flash Block Indicator, 33 Open lid, 32 Pause, 33 Protocol AutoWriter, 43 Protocol Editor, 39 Resume, 33 Show Analysis Settings, 55, Skip Step, 33 A Add Repeats, 32 Adding Beep, 42 Extend, 42 Increment, 42 Ramp rate, 42 Repeats in run, 32 Adjusting Allelic Discrimination data, 99 Data an
Index Relative quantity with, Creating Data report, 104 Protocol, 43 Well groups, 56 Custom Data View, 100 Custom Export, 83 Cycles to Analyze, 78 126 D -d(RFU)/dT Spreadsheet, 96 Data Files, 9 Data analysis About, 71 Adjusting, 71 Charts, adjusting, 81 Clearing wells, 81 Data analysis, 98 End Point, 96 Excluding wells, 80 Formula, 126 Gene Expression, 109 Melt Curve, 92 Menu bar, 72 Plate content, 71 Toolbar, 72 Well contents, 71 Well groups, 56 Well selector, 78 Data file Report, 103 Data report Creati
CFX96 Touch, CFX96 Touch Deep Well, CFX Connect, and CFX384 Touch Systems Instruction Manual Right-click for graph, 114 Scaling options, 113 Spreadsheet, 114 Gene Study, 122 Files, 9 Inter-run calibration, 122 Preparing data, 123 Report, 124 Study Analysis tab, 123, 124 Study Setup tab, 123 GOI Normalization factor, 128 Normalized expression, 128, 129, Relative quantity, 126, 127 SD Normalized expression, 130 GOTO Adding repeats, 32 Inserting, 40 Gradient Inserting, 40 Step, 40 Gradient Calculator, 38 LIMS
Index O Open Lid button, 32 Opening Lid, 32 Melt Curve tab, 92 Protocol AutoWriter, 43 Protocol Editor, 37 Operation requirements, 1 P Pause Button, 33 Run, 33 Plastic Consumables, 10 Plate Contents of wells, 51 Files, 9 Melt Curve Data, 95 Size, in Plate Editor, 46 Spreadsheet, 57, 95 Type, 46 Well contents, 51 Plate Editor Clear Replicate #, 53 Clear Wells button, 53 Clearing wells, 81 Concentration, 52 Dilution Series, 53 Excluding wells, 80 Experiment Settings, 53 Export plate spreadsheet, 57 Import p
CFX96 Touch, CFX96 Touch Deep Well, CFX Connect, and CFX384 Touch Systems Instruction Manual Data file, 103 Gene Study, 124 Requirements Operation, 1 Results, 121 Resume button, 33 Resuming a run, 33 RFU Allelic Discrimination, 98, 101 End Point tab, 96, 97 Melt Curve tab, 92 Right-click Gene expression graph, 114 Run Adding repeats, 32 Cancelling, 33 Flash block, 33 Pausing, 33 Skipping a step, 33 Stopping, 33 Run Details Real-Time Status tab, 33 Run Status, 32 Time Status tab, 34 Window, 31 Run Informatio
Index End Point, 97 Melt Curve Data, 93 Quantification, 74 Quantitation, 72 Real-Time Status, 33 Run Information, 102 Study Analysis in Gene Study, 123, Study Setup in Gene Study, 123 Time Status, 34 Target Analysis Mode, 78 Target Name, 51 Targets Experiment Settings, 54, 116 Reaction efficiency (E), 88 Technical Notes, ii Specialists, ii Temperature Step, 39 Temperature Control Mode, 43 Temperature control Block mode, 43 Mode, 42 Threshold Adjusting, 75 Thresholds Window, 77 Time Status tab, 34 Toolbar Da
Bio-Rad Laboratories, Inc. Web site www.bio-rad.