SmartSpec™ 3000 Spectrophotometer Instruction Manual Catalog Number 170-2501 For Technical Service Call Your Local Bio-Rad Office or in the U.S.
Table of Contents Page Section 1 General Safety Information ........................................................................1 1.1 1.2 Caution Symbol..........................................................................................................1 Precautions .................................................................................................................1 Section 2 Product Description .....................................................................................
Warranty The SmartSpec 3000 Spectrophotometer and accessories are warranted against defects in materials and workmanship for one year. If any defects occur in the instruments or accessories during this warranty period, Bio-Rad Laboratories will repair or replace the defective parts at its discretion without charge. The following defects, however, are specifically excluded: 1. Defects caused by improper operation. 2.
Section 1 General Safety Information This instrument is intended for laboratory use only. This product conforms to the "Class A" standards for electromagnetic emissions intended for laboratory equipment applications. It is possible that emissions from this product may interfere with some sensitive appliances when placed nearby or in the same circuit as those applications. The user should be aware of this potential and take appropriate measures to avoid interference. 1.
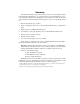
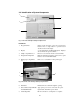
2.2 Identification of System Components 5 2 4 1 3 Fig. 1. View of the SmartSpec 3000 Spectrophotometer. Instrument 1. Keypad interface Change menu and select options by pressing these buttons. Press a single button to perform action described on the menu display. 2. Display 2 x 24 alphanumeric backlit LCD display. Displays various menus and options available. 3. Sample compartment door Lift door to insert cuvette into the cuvette chamber. 4.
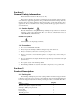
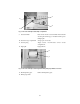
11 10 12 9 Fig. 3. View of the SmartSpec 3000 sample compartment. 9. Cuvette chamber Insert cuvette into the cuvette chamber. Insure that the cuvette is placed in the proper orientation with respect to the light path. 10. Cuvette storage compartment Storage space for cuvette. 11. Cuvette spring Aligns cuvette. Accommodates various cuvette configurations. 12. Light path Light path axis. 14 13 Fig. 4. View of the SmartSpec 3000 integrated thermal printer paper with door removed. 13.
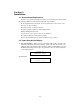
Section 3 Installation 3.1 Environmental Requirements To insure correct operation and stable performance over an extended period of time, install the SmartSpec 3000 in a location which meets the following conditions: • Room temperature between 20 and 35 °C. Not recommended for cold room use (4 °C). • Not exposed to direct sun light. • Not subject to direct or continuous vibration. • Not subject to intense magnetic or electromagnetic fields. • Relative humidity between 0–95%.
Section 4 Introduction UV/Visible Spectroscopy is based on the absorption of light as a function of wavelength. All spectrophotometers have a light source that generates light of specific wavelengths. The SmartSpec 3000 uses a xenon flash lamp as its light source. Xenon flash lamps have several advantages over the conventional light sources in that they reduce warm up time, do not heat up the instrument and have a lamp life of 10 to 15 years.
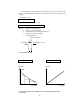
The Lambert-Beer’s law identifies the relation between sample concentration and the intensity of transmitted light. Absorbances and % transmittances are defined by the following equations: % Transmittance (%T) %T = It/I0 * 100 = 10-εcl * 100 Absorbance or optical density (A or O.D.
4.1 Setup When the SmartSpec 3000 is not carrying out an assay, you can enter the Setup routine by pressing Setup. To proceed through Setup without changing the current setting, press Enter. Most of the current settings can be changed by pressing Select until you see your desired choice; sometimes you have to use the number pad to change an entry. In either case, press Enter after the selection is made. When you have gone all the way through Setup, SmartSpec 3000 will automatically return to Home screen.
2. Background compensation. When using the DNA/RNA assay, you can choose to have SmartSpec 3000 automatically subtract background absorbance readings collected at 320 nm from the A260 and A280 measurements. If the background subtraction option is invoked, then the A320 is subtracted from the A260 and A280 readings before these measurements are displayed and before they are used in the calculation of nucleic acid concentration. The default condition is to subtract the A320 background.
6. New Operator. When SmartSpec 3000 prints a report, it includes the name of the operator (if specified). You can add a new operators name to the list of operators in Setup. Want to add the name of a new operator? No Press Select to toggle from No to Yes and the screen will change to Enter new operator's name: (8 char): The keyboard will automatically switch to the alpha mode and you can use the keys to enter a name with as many as eight characters. To enter an A in the first space, press the 2 key once.
• Use the number pad to input the new date. Press Enter to move to the next field. Press Select to set the day of the week. Press Enter when you are finished. 11. Time convention. You may choose to print time in 12-hour or 24-hour mode. Toggle between the choices by pressing Select. and then press Enter. Select time display mode 24-hr e.g. 13:12 Press Select for Select date display mode DD-MM-YY e.g. 25-11-98 12. Date convention. You can choose to print the date in either MM/DD/YY or DD-MM-YY mode.
Section 5 Keypad Description Print SmartSpec 3000 will print data on the current sample, a user-selectable range of samples or all samples in the current assay. Abs SmartSpec 3000 will automatically display the absorbance reading of the current sample and the wavelength being read. If more than one wavelength is being read, press Abs to toggle among the different wavelengths.
Protein SmartSpec 3000 will automatically read one or more wavelengths depending on the type of assay specified (Bradford, Lowry, BCA or UV Protein) or the user can specify a wavelength. SmartSpec 3000 will convert absorbance data to concentration by use of a standard curve, except for the case of UV Protein in which the absorbance readings are multiplied by user-selectable constants. The standard curve can be one recalled from memory, or a new one constructed by SmartSpec 3000.
Cancel Cancels the last entry or causes an exit from Setup. When editing sequence information, press Cancel to delete a base. When Options are displayed, press Cancel to return to the assay. < and > Used to access other menus or screens. Also used to move the cursor. Paper Feed Feeds paper through the printer. Alpha The Alpha key allows the user to toggle between alpha and numeric input for naming stored standard curves or naming operators. When in alpha mode, an LED is illuminated on the key.
ii. Choose standard curve option. a. Create a new standard curve. b. Recall a standard curve from memory. c. No standard curve. SmartSpec 3000 will not be able to convert absorbance to concentration. C. Scan i. Set upper and lower limits of scan. ii. Choose whether to subtract background and, if so, specify background wavelength. iii. Choose fast or slow scan. iv. For the fast scan, choose number of successive scans. D. Kinetic i. Choose wavelength to read. ii. Choose duration of data collection. iii.
Section 7 Operating Instructions Note: It is Good Laboratory Practice (GLP) to use the Smart Spec 3000 spectrophotometer to measure absorbances in the range of 0.100 to 1.500 AU. 1. Choose an assay. SmartSpec 3000 has six different assay keys in the second row of buttons. When you press one of them, it signals SmartSpec 3000 to clear its memory of absorbance readings from the previous assay, to reset the sample number to 1, and to reset the dilution factor to 1.
The SmartSpec 3000 Bradford, Lowry, BCA and Other Protein assays use standard curves created by measuring the absorbances of solutions of known concentration to determine the concentration of unknown samples. If you do not want to construct a new standard curve, you may recall one from the on-board memory. SmartSpec 3000 has the capability of storing up to ten standard curves in memory. The stored curves are numbered automatically from 0 to 9, or you can overwrite the number.
Limitations of the methods. The linear regression, when fit properly, generally produces reliable results at the extremes of the range of the standard curve. Results calculated from mean absorbance data outside the range of the standard curve may be unreliable. (For the purposes of this discussion, the range of the standard curve is defined as the absorbance range between the highest and lowest mean absorbances of the standards used to form the standard curve.
2. Choose sample replicates. Samples may be read in replicate and you do not have to have the same number of replicates for each different sample. For each sample replicate group, SmartSpec 3000 will calculate a mean absorbance and standard deviation. When the full report is printed, each individual absorbance is reported along with the mean and standard deviation of the replicate group.
• Press the right arrow key to change the number of sample replicates. Enter number of sample replicates: _____ B. Sample replicates. • Place the first replicate of your first sample in the cuvette chamber and press Read Sample. Before it collects the absorbance data, SmartSpec 3000 will ask for the number of replicates for the first sample. Sample #1 Enter number of replicates: 3 >=Option • Use the number keys to input the number of replicates and press Enter.
• Press A260:A280 to see the ratio displayed A260= x.xxx A260:A280 = • For DNA oligos and RNA oligos, press Conc to see the concentration displayed in units of pmoles/µl. A260= Conc= • A280= x.xxx x.xxxx x.xxx xxx.xxx Samp #1 pmoles/µl To read the next sample, insert the cuvette in the chamber and press Read Sample. From any of the above screens you can press Enter to return to the Ready screen. Ready to Read absorbance <=Exit Assay >=Options B. Protein.
• Now press Select and the negative sign will be displayed in front of 0.500. Min AU scale: +/- -0.500 Max AU scale: • Press Enter again and now define the upper limit. The upper limit must be a positive number. After the scan data are printed, or if you choose not to print the scan data, you are next offered the opportunity to download the data via the serial port to a computer. Press when ready to accept serial data.
• If you want to download the data, make sure the connections are made to the computer and then press Enter. If you do not want to download the data, press Cancel. Ready to Read Absorbance <=Exit Assay >=Options After the data are downloaded SmartSpec 3000 will reset for the next kinetic data collection. From the Ready screen, you can change any of the parameters for the kinetic data collection. E. OD600.
8. Exit the Assay. You can exit the assay by pressing the left arrow key when the Ready screen is displayed. Ready to read absorbance <=Exit Assay >=Options SmartSpec 3000 will prompt you to save a newly created standard curve and then prompt you to print a complete report of absorbances, concentration and A260:A280 ratios. The report will also show means and standard deviations for each standard or unknown sample replicate group.
• After the default conversion factor is accepted or changed, SmartSpec 3000 is ready to measure nucleic acid absorbance and convert that absorbance to concentration. Ready to read absorbance <=Exit Assay >=Options B. DNA oligonucleotides and RNA oligonucleotides. If you choose DNA oligo or RNA oligo, you must provide the molecular weight of the oligo and either the molar extinction coefficient or the mass/absorbance conversion factor. If you don’t know them, then SmartSpec 3000 can estimate them for you.
b. If you do not know the molecular weight. Enter oligo composition: #A:___#C:___#G:___#T:___ • Use the number keys to input the number of A’s, then press Enter to move the cursor to the next field and enter the number of C’s. After entering the number of T’s (or U’s for RNA oligos), press Enter. SmartSpec 3000 will calculate the molecular weight and display it along with the molar extinction coefficient. Mol Ext Coef=xxxxxxx MW=xxxxx >=Continue • ii. Press the right arrow key to continue the assay.
• Press > to continue the assay, and the screen will display Ready to read absorbance <=Exit Assay >=Options • SmartSpec 3000 is now ready to collect absorbance data. b. If you do not know the molecular weight. Enter oligo composition: #A:___#C:___#G:___#T:___ • Use the number keys to input the number of A’s, then press Enter to move the cursor to the next field and enter the number of C’s. After entering the number of T’s (or U’s for RNA oligos), press Enter.
• Use the number keys to input the length of the oligo and press Enter. You can enter a length of up to 99 nucleotides. After you press Enter, SmartSpec 3000 will calculate and display the extinction coefficient and molecular weight. Mol ext coef= MW= __________ >=Continue The molar extinction coefficient is displayed with units of liter mole-1 cm-1 • Press the right arrow to continue the assay.
• Press the right arrow to continue the assay. SmartSpec 3000 will now be ready to measure the absorbance of your oligonucleotide and to convert those absorbance data into concentrations of µg/ml and pmol/µl. Mol ext coef= __________ MW= _________ >=Continue Protein Assay 1. Choosing the type of assay.
3. Standard Curves. Once you have selected the type of assay, SmartSpec 3000 will ask if you want to make a new standard curve. You can decline to make a standard curve, in which case it will not be possible for SmartSpec 3000 to convert absorbance readings to concentration; you can recall a saved standard curve from memory, or you can create a new standard curve. Do you want to make a new standard curve? Yes If you want to make a new standard curve, press Enter and skip ahead to part B below.
• In order to see the information about the standard curve, press Select to toggle from No to Yes and press Enter. r2=x.xxx CONC=ABS*M +I 0=Show more >=Continue r2 refers to the square of the correlation coefficient and is a value between 0 and 1, with 1 representing a perfectly straight line (see discussion above). The general equation of the curve fit is presented in the top right part of the display Concentration = Absorbance*Slope + Intercept • Press 0 to see the slope.
• Each time you place a new blank into SmartSpec 3000, press Read Blank. After the absorbance reading is collected, the instrument is zeroed and the display will show Blanking Spectrophotometer You can check the absorbance reading at any time by pressing Abs. A750 = 0.000 >=Continue • Press the right arrow key to return to the assay.
i. If there are no standard replicates. SmartSpec 3000 will direct you to enter the concentration of each standard and then to measure the absorbance of each standard. Enter concentration of standard #1: ________ • Use the number keys to input the concentration of standard #1 and press Enter. You may enter concentrations with as many as eight significant digits, but all results are reported with four significant digits because SmartSpec 3000 absorbance data are measured to four significant digits.
• If you have varying numbers of replicates for the different standards, press Select to toggle from Yes to No and press Enter. Skip ahead to b. If you have the same number of replicates for each standard, press Enter. a. If there are the same number of replicates for each standard. You can have as many a nine replicates for each standard Enter the number of standard replicates: ___ • Use the number keys to input the number of standard replicates and press Enter.
After all replicates of standard #1 are measured, SmartSpec 3000 asks for the concentration of standard #2 and directs you to put the replicates into SmartSpec 3000 one at a time until all are read. Enter concentration of Standard #2: __________ Insert Rep #1 of Std #2 and PRESS Read Sample • • • Insert Rep #9 of Std #1 and PRESS Read Sample This process continues until all replicates of all standards have been read.
b. If there are varying numbers of standard replicates. Each time SmartSpec 3000 prepares to read a standard, you will be prompted for the number of replicates for that standard and then for the concentration of the standard. After all replicates of the first standard are read, then SmartSpec 3000 will prompt for the number of replicates of the second standard and then for the concentration of the second standard. This will continue until the last replicate of the last standard is read.
After all replicates of standard #1 are measured, SmartSpec 3000 asks for the number of replicates of standard #2 and then the concentration of standard #2 before prompting you to insert each of the replicates of standard #2.
The display with show either A750 = x.xxx Std #1 Rep #2 >=Continue • or A750 = x.xxx +- x.xxx Std #1 Mean >=Continue Press the right arrow key to return to the assay. After the last replicate of the last standard is measured, SmartSpec 3000 will construct the standard curve. C. Editing standard curve data. After the absorbance of the last replicate of the last standard has been read, SmartSpec 3000 will offer you a chance to edit the data set before constructing the standard curve.
SmartSpec 3000 will now direct you to insert blank (if you chose that option above) and the to insert the specified standard. When the absorbance data have been collected, SmartSpec 3000 will offer you an opportunity to continue re-reading other samples. Continue rereading Standards? Yes • If you want to re-read another sample, press Enter. Otherwise press Select to toggle from Yes to No and press Enter. 1. Edit Concentrations 2.
If the slope or intercept has a value greater than 9999 or less than 0.0001, it will be shown in exponential notation. In all cases with SmartSpec 3000, e represents the base 10, not the base of the natural logarithm. For example, 100,000 would be represented as 1.000 e 05 and 0.00001 would be represented as 1.000 e-05. • Press 0 to see the creation date of the standard curve.
When you rescale the X axis, you must input the new maximum X value and press Enter. A new maximum Y value is automatically calculated and the graph is plotted. Max conc=150.0000 Enter new max: When you rescale the Y axis, you must input the new maximum Y value and press Enter. A new maximum X value is automatically calculated and the graph is plotted. Max abs=1.
Scan. SmartSpec 3000 can collect data over a range of wavelengths and then plot those absorbances. There are both Fast and Slow scans: the fast scan generally takes a minute or less to accomplish while the slow will take several minutes, but results in more accurate absorbance data and a smoother curve. The scanning time is dependent on the range scanned and the absorbance of the sample. You can improve the accuracy of fast scans by specifying more than one repetition of the scan.
• Use the number keys to input the number of successive scans and press Enter. SmartSpec 3000 will now display the Ready screen. If you want to invoke the smoothing option or the subregion option, choose Options from the Ready screen. Ready to read absorbance <=Exit Assay >=Options 1. Repetitions 2. Range 3. Background >=More The first three options allow you to change the conditions already specified above. Press the right arrow key to see the other options. 4. Subregions 5.
Kinetics. When you press Kinetic, you begin by specifying the reading wavelength. Enter reading wavelength for kinetic assay: nm • Use the number keys to input the wavelength to be read and press Enter. Enter duration of timed seconds assay : • Use the number keys to input the duration of the assay in seconds and press Enter. You may collect data for as long as 9999 seconds. Enter interval of data collection: sec • Use the number keys to input the interval between successive readings and press Enter.
OD 600. This assay is useful for monitoring growth of bacterial cultures. When you press OD600, SmartSpec 3000 will display the current conversion factor and offer you the choice of accepting or modifying it. A600 1.0=xx.xexx cell/ml Is this factor OK? Yes • If the displayed conversion factor is acceptable, press Enter. Otherwise, press Select to toggle from Yes to No and press Enter. Enter new conversion factor; xx.
λ . This assay allows you to collect absorbance data from up to three different wavelengths simultaneously. No concentrations are calculated. When you press λ, SmartSpec 3000 will prompt you first for the number of wavelengths to read. Enter number (1–3) of wavelengths to read: 3 • Use the number keys to input the number of wavelengths to be read and press Enter. SmartSpec 3000 will then ask for each individual wavelength.
Section 9 Troubleshooting 9.1 Troubleshooting Table Problem Unit does not power up Cause Solution Power switch in off position. 1. Check power switch on back of unit. No power from outlet. 2. Check power source. Bad power cord. 3. Replace. LCD display difficult to read Back lighting burned out. 1. Call Bio-Rad service. Contrast setting out of adjustment. Printer jam Thermal paper caught between print head and thermal plate when tearing off paper. 1.
Problem Negative values/no absorbancy Cause No sample. Solution 1. Add Sample to solution Cuvette light path orientation incorrect. Wrong wavelength setting. 2. Check cuvette window orientation. 3. Check assay wavelength requirement. 4. Reblank the instrument using buffer or water. May have blanked the instrument using sample instead of blank solution. Cuvette window "Z" height incompatible with cuvette chamber. (See Section 12.4.) Fluctuations Interference in light path. 5. Use only 8.
10.3 Changing Thermal Printer Paper New paper roll Plastic core shaft Paper feed in direction Pa pe r ou t Remove door cover Slot opening Paper storage Serrated edge paper tear Installing New Thermal Printer Paper Note: Use only Bio-Rad recommended thermal paper catalog number 170-2506. • Remove printer paper door cover by pushing down on the center of the door and sliding the door back away from the unit.
Section 11 Specifications 11.1 Specifications Product Specifications SmartSpec 3000 Spectrophotometer Wavelength range: UV and Visible ranges Wavelength accuracy Spectral bandwidth Light source Detector Number of cuvettes Size of cuvettes Pathlength Display Printer Interface Operating temperature Photometric range Scan speed Photometric repeatability Dimensions Weight Power requirement Regulatory 200 to 800 nm (+/-) 2 nm 5 nm Xenon flash lamp Photodiode array one 100 µl, 700 µl, 1.5 ml, 3.
III. DNA and RNA Oligonucleotide Concentration: • Concentration = A/(εb) * 106 pmole/µl • Concentration = A/(εb) * MW * 103 µg/ml where A = absorbance, ε = molar extinction coefficient in liter/mole/cm, b = pathlength in cm and MW = molecular weight. For cuvettes with a 10 mm (1 cm ) pathlength, these equations simplify to: • Concentration = A/ε * 106 pmole/µl = (µg/ml)* (1000)/MW • Concentration = A/ε * MW * 103 µg/ml = (pmol/µl) * (MW)/1000 IV.
Section 12 System, Accessories, and Reagents for the SmartSpec 3000 12.1 Product Information Catalog Number Product Description SmartSpec 3000 Spectrophotometer and Accessories 170-2501 SmartSpec 3000 Spectrophotometer 170-2502 Standard 1–3.5 ml Cuvette, quartz 170-2503 Semi-microvolume 1.4 ml Cuvette, quartz 170-2504 Microvolume 700 µl Cuvette, quartz 170-2505 Sub-microvolume 100 µl Cuvette, quartz 170-2415 Standard Cuvette, 1–3.5 ml, polystyrene disposable cuvettes, 100 223-9950 Standard 3.
12.3 Cuvette Selection Guide Catalog Number Minimum Volume Maximum Volume Cuvette Type 170-2502 1,000 µl 3,500 µl Standard cuvette, quartz 10 mm 170-2503 500 µl 1,400 µl Semi-microvolume cuvette, quartz 10 mm 170-2504 200 µl 700 µl Microvolume cuvette, quartz 10 mm 170-2505 75 µl 100 µl Sub-microvolume cuvette, quartz 10 mm Pathlength 12.4 Selecting the Appropriate Cuvette The SmartSpec 3000 has 1 mm, 2 mm, 5 mm and 10 mm pathlengths.
12.5 PC Serial Connection Instructions 1. Connect RS232 9-pin serial cable from SmartSpec 3000 to computer. 2. Using a terminal program (e.g. HyperTerminal), set the connection to 9600 baud, 8 bitsno-parity-1 stop bit (9600-8-N-1), no flow control. 3. In addition to the actual data transmission/reception parameters, other parameters in HyperTerminal may have to be set. The correct settings may vary from computer to computer, but these are settings currently used and offered as an example.
5. Capturing data in HyperTerminal and saving the data in a file: In the main HyperTerminal window menu, first click Transfer and then click Capture Text. Transfer Capture Text . . . [give file name and path] e.g. c:\program files\accessories\hyperterminal\capture.txt A dialog box with the default file name, file extension and file path will appear. Accept the default, or type in a new path and/or file name. Use the SmartSpec and send data from the SmartSpec to the computer.
Bio-Rad Laboratories Life Science Group Web site Also in: Australia Brazil Denmark Israel Korea The Netherlands Austria Belgium Ph. 09-385 55 11, Fx. 09-385 65 54 Finland Italy France Ph. 01 47 95 69 65, Fx. 01 47 41 9133 Japan Ph. 47-23-38-41-30, Fx. 47-23-38-41-39 Sweden Ph. 46 (0)8-55 51 27 00, Fx. 46 (0)8-55 51 27 80 Switzerland Ph. 061-717-9555, Fx. 061-717-9550 United Kingdom Ph. 0800-181134, Fx.