
User's Manual

61-89A-50-A18-G1-UserMan page 10 of 20
TX RX Systems Inc. Manual 7-9352 (version 4) 01/27/04 Page 10
pen at a high enough level to damage the power
amplifier stages. In general, if one or both antenna
ports are connected to sections of radiating coaxial
cable (lossy cable) the isolation will be more than
adequate because of the high coupling loss values
that are encountered with this type of cable. When
a network of antennas are used for the input and
output, this problem is much more likely. Isolation
values are relatively easy to measure with a spec-
trum analyzer and signal generator.
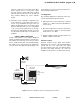
Procedure for Measuring Antenna Isolation
1) Set the signal generator for a 0 dBm output
level at the center frequency of one of the signal
boosters passbands.
2) Set the spectrum analyzer for the same center
frequency and a sweep width equal to or just
slightly greater than the passband chosen in
step one.
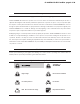
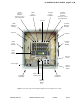
3) Connect the test leads of the signal generator
and the spectrum analyzer together using a
female barrel connector, see
Figure 2
. Observe
the signal on the analyzer and adjust the input
attenuator of the spectrum analyzer for a signal
level that just reaches the 0 dBm level at the top
of the graticule.
4) Referring to figure 2, connect the generator test
lead to one side of the signal distribution system
(external antenna) and the spectrum analyzer
lead to the other (internal distribution system)
and observe the signal level. The difference
between this observed level and 0 dBm is the
isolation between the sections. If the signal is
too weak to observe, the spectrum analyzer's
bandwidth may have to be narrowed and its
input attenuation reduced. Record the isolation
value.
The isolation value measured should
exceed the signal boosters gain figure by at
least 15 dB.
It is wise to repeat the procedure listed above for
measuring antenna isolation, with the signal gener-
ator set to frequencies at the passbands edges in
order to see if the isolation is remaining relatively
constant over the complete width of the passband.
Increasing Isolation
If the measured isolation does not exceed the sig-
nal boosters gain figure by at least 15 dB then
modification of the signal distribution system is
required. Alternately, the gain of the signal booster
can also be reduced to insure the 15 dB specifica-
tion is met. If the isolation cannot be increased
then the amount of gain reduction required is deter-
mined as shown in the following example.
Input Signal Levels
Excessive input signal levels can damage the sig-
nal booster. Although this problem is less severe in
OLC protected systems, strong signals may cause
sudden reductions in gain and an associated
decrease in the desired output signal strength.
Even in the most carefully designed signal distribu-
tion systems, unpredictable situations can arise
that can cause this trouble. A few of the more com-
mon causes are:
a) Unintended signals entering the system. Prima-
rily caused by radios operating on channels that
are within the operational bandwidth of the sig-
nal booster. Sometimes this will be a transient
problem caused by mobile units when they
transmit while in close proximity to your system.
b) Hand-held and mobile units that approach
much closer than expected to one of the anten-
nas in the signal distribution system.
c) Unexpected signal propagation anomalies.
Building geometry can cause signal ducting and
other phenomena that cause signal levels that
are much stronger (or lower) than expected.
d) Lower than estimated signal attenuation causes
signals to be unusually strong. Higher losses
can also occur giving weaker signals than
desired.
e) Signal booster model with excessive gain. In
systems that have an existing signal booster, it
is sometimes assumed that an identical unit
should be installed when expanding the system
EXAMPLE
Gain Reduction (dB) = Minimum Isolation (dB) -
Measured Isolation (dB)
If the measured isolation is -75dB and the mini-
mum isolation is -80dB then the amount of gain
reduction required is: -80dB - (-75) = -5 dB