
User`s guide


© TELENAV, INC. 2003-2007 PAGE 31 OF 52
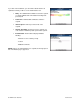
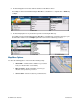
If you click on an incident line, you can view the details. Below is an
explanation of what you will see on the Traffic Detail screen:
• Delay – The additional time it will take to travel the segment
as compared with the time it would take if traveling at the
posted speed.
• Travel Time – Estimated time it will take to travel the
segment.
• Slowest Speed – Slowest speed observed on the
segment.
• Average Speed Bar – Average speed of a segment on a
scale of 0 to the maximum-posted speed for that segment.
• Incident Detail – Each incident is displayed with the
following:
-Incident icon color-coded by severity
-Location
-Additional comments
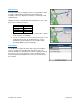
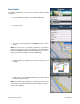
NOTE: If there is no flow information for a segment, the Average Speed
bar on the Details page is grayed out.