ChemBioDraw 13.
ChemBioDraw 13.
ChemBioDraw 13.
ChemBioDraw 13.
ChemBioDraw 13.
ChemBioDraw 13.
ChemBioDraw 13.0 What’s new ChemBioDraw has long been the preferred tool for illustrating chemical and biological concepts. ChemBioDraw 13.0 introduces a variety of improvements and new features that are briefly described below. You can find more information on these and other features throughout the PDF guide and online help. Please note that the contents of both these documents are identical; they only differ in format. Biopolymer Builder Enhancements.
ChemBioDraw 13.0 Lactam bridges -You can form lactam bridges between residues with available amino and carboxylic acid leaving groups, such as Lys-Asp and Lys-Glu. For more information, see "Lactam bridges " on page 75. Merging sequences- You can merge multiple sequences into one sequence by bonding together their terminal residues. Hybrid biopolymers - You can create hybrid (also called 'chimeric') biopolymers containing peptide, nucleotide, and linker residues, using the Biopolymer toolbar.
ChemBioDraw 13.0 Polymer Bead Enhancements. You can resize polymer beads. For more information on polymer beads and other attachment points, see "Attachment points" on page 99. New Toolbars. Several new toolbars including Structure, Curves, Windows, and Biopolymer toolbars have been introduced in ChemBioDraw 13.0. You can access these toolbars from the View menu. Color by Element. Atom labels may now be colored using colors associated with their atomic symbols.
ChemBioDraw 13.0 Introduction Designed for scientists, students, and scientific authors, ChemBioDraw 13.0 is a powerful yet easy-to use tool for producing biological and chemical drawings. You can create your own drawings or use those provided in the library of available templates. About this manual This manual describes all the features in ChemBioDraw 13.0 and their use. Some tasks described in this manual must be performed in conjunction with other software.
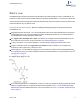
ChemBioDraw 13.0 Figure 1.1: A)Status bar displaying information about solid bond. Serial number and technical support For more information on obtaining serial numbers and registration codes, see the online Services Web site. Technical support is available to registered users through the Internet and our Technical Support department.When contacting Technical Support, always provide the serial number of your ChemBioOffice application.
ChemBioDraw 13.0 Install more physical RAM. The more you have, the less ChemBioOffice Desktop Applications will have to access your hard disk to use Virtual Memory. Increase the Virtual Memory (VM). Virtual memory extends RAM by allowing space on your hard disk to be used as RAM. However, the time for swapping between the application and the hard disk is slower than swapping with physical RAM.
ChemBioDraw 13.0 Getting started This section will help you become familiar with the user interface. ChemBioDraw user interface By default, the user interface displays commonly used toolbars, the main menu, and document status bar. The user interface appears below: a. menu bar b. BioDraw toolbar c. magnification controls d. document window e. Main toolbar f.
ChemBioDraw 13.0 Toolbars In ChemBioDraw 13.0, several new toolbars have been introduced, such as Structure, Curves, Windows, and Biopolymer toolbars. To display or hide a toolbar, select it in the View menu. A check mark appears next to the toolbar name when it is visible. You can also hide the toolbar by clicking on the 'X' icon on the upper right corner of the toolbar. The main toolbar The main toolbar includes the tools most commonly used for drawing structures.
ChemBioDraw 13.0 BioDraw toolbar The BioDraw toolbar contains drawing tools for adding biological and biochemical elements to your drawings. See "BioDraw" on page 51 for more information. Documents A document is a workspace where you create and edit structures. A document may contain multiple pages, or a single page. Creating documents You can create a new document using either the default settings, or a Style Sheet with customized settings. To create a document, go to File>New Document.
ChemBioDraw 13.0 b. Enter a keyword in the New Keyword text box. c. In the New Content text box, enter the notes to apply to the document and click Add. 3. Click OK. Deleting a keyword When you delete a keyword, the annotation for that keyword is also deleted. 1. In the Annotate dialog box, select the keyword from the Keyword list. 2. Click Delete Keyword. Click Yes when prompted for confirmation. 3. Click OK. Discarding changes To retrieve the last saved version of a file, go to File>Revert.
ChemBioDraw 13.0 2. Enter the description and click OK. Autosave You can configure ChemBioDraw 13.0 to periodically save an open document. 1. Go to File>Preferences. The Preferences dialog box appears. 2. Click the Open/Save tab. 3. Click the Autosave Every check box and enter the minutes to use. The time starts after you make your first change to the document. Default file format 1. Go to File>Preferences. The Preferences dialog box appears. 2. Click the Open/Save tab. 3.
ChemBioDraw 13.0 2. Enter your Dropbox username and then click OK. The Authorization Confirmation dialog box appears. 3. Click OK. The Cloud Linking Confirmation window appears. 4. Enter your Dropbox account email address and password. Click Sign in. 5. Click Allow. The Cloud Linking Confirmation window displays a success message. 6. Click Done. Note: You need to authorize ChemBioDraw’s interaction with Dropbox folder only when you access Dropbox from ChemBioDraw 13.0 for the first time.
ChemBioDraw 13.0 5. Select a folder location to save the file. You can create a new folder by either double-clicking within the folder list column, or double-clicking the Create new folder link.Specify the new folder name, and click OK. 6. (optional) If you want to change the file name, enter the new file name in the File name textbox at the bottom of the dialog box. 7. (optional) Specify a time limit for the upload process to complete, by specifying a value in ‘seconds’ in the Time out limit textbox.
ChemBioDraw 13.0 Note: You can specify a time limit for the download process to complete, by specifying a value in ‘seconds’ in the Time out limit textbox. You can specify any value between a minimum of 5 seconds and a maximum of 120 seconds as the time out limit.
ChemBioDraw 13.0 Basic drawings ChemBioDraw 13.0 provides a variety of tools for drawing everything from simple chemical structures to complex reactions. In this section, we introduce basic techniques to help you create your first structures. We also explain how to add features such as arrows and shapes to enhance structures and reactions. For more drawing features, see "BioDraw" on page 51 and "Advanced drawing techniques" on page 95.
ChemBioDraw 13.0 Quadruple bonds There are three ways to draw a quadruple bond: Draw a bond using the Quadruple Bond tool. Using the Solid, Dashed, or Bold Bond tool, drag from one end of an existing triple bond to the other end. Using any bond or selection tool, point to an existing bond and type ‘4’. To change a quadruple bond into a single bond: 1. Select any bond tool. 2. Drag from one end of an existing quadruple bond to the other.
ChemBioDraw 13.0 Moving Atoms Layering bonds Changing bond types Change a single bond from one type to another by doing either of the following: Select a bond tool and click an existing bond. Right-click and select the new type from the context menu. You can also use hotkeys. See "Shortcuts and hotkeys" on page 304. Changing double bonds To change one type of double bond to another: 1. Select the Bold, Dashed, or Solid Bond tool. 2. Click a double bond. The double bond changes to the new bond type.
ChemBioDraw 13.0 Reducing ring size You can reduce the number of atoms in a ring. For example, you can convert cyclohexane to cyclopentane. To reduce the ring size, do one of the following: Using the selection tool, click and drag. Using a bond tool, point to an atom and SHIFT+drag. Release when one atom is on top of the other. The bond between the atoms disappears. Note: You can also move atoms using a selection tool. See "Moving objects" on page 42.
ChemBioDraw 13.0 The bonds in the new structure appear at standard 120° angles. Changing fixed values By default, bond lengths are .4176 inches and bond angles in a chain are 120°. To change these values: 1. Go to File>Document Settings and click the Drawing category. 2. Enter a value in the Fixed Length text box. Use in, cm, pt, or picas for units. 3. Enter a value in the Chain Angle text box. 4. Click OK. For more information on drawing settings, see "Drawing settings" on page 260.
ChemBioDraw 13.0 Click a symbol to highlight the atom and activate the Text tool. Move the mouse across the table to highlight each atom. To add an atom. Select the desired element in the periodic table and click an empty space in the document. The atom appears in its chemically neutral form. For example, carbon appears as CH and hydrogen appears as H . 4 2 To label an atom. Click an existing unlabeled atom. To change the oxidation state.
ChemBioDraw 13.0 1. Draw the phenol structure. 2. Using the Text tool, click below the drawing and type “Phenol” in the text box. 3. Click outside the text box. To edit the caption, click in the text box with the text tool and begin typing. For more information, see "New lines and closing text boxes" on page 257. Formatting Each new caption or atom label uses default document settings for the font, size, and style of captions and atom labels.
ChemBioDraw 13.0 To specify a font, style, and size for selected text, do one of the following: Choose the font and size from the Text menu. Right-click and choose the font and size from the context menu. From the Style Toolbar, select the font and size from the drop-down menus. Coloring text You can color captions and atom labels before or after they are typed, and as a whole or in part. To color a caption or atom label: 1. Select the Text tool. 2.
ChemBioDraw 13.0 2. Choose a color from the Color menu. Caption width To edit the width of a caption: 1. Select the caption using the Text tool. A resize handle appears on the right side of the caption. 2. Drag the resize handle to change the width of the caption. About fonts ChemBioDraw 13.0 uses the fonts installed on your computer. If a ChemBioDraw document contains fonts that are not available on a particular computer, they are substituted with the available fonts.
ChemBioDraw 13.0 Hotkeys HotKeys are keys on your keyboard that are linked to specific atom labels. Use ChemBioDraw hotKeys to quickly label atoms and apply atom properties. The Hotkeys.xml file in the ChemDraw Items folder contains the hotKeys provided with ChemBioDraw. You can add or change hotKeys by editing this file in a text editor. Using hotkeys Using hotkeys, you can add functional groups to your structures with one keystroke. For example, to add tert-butyl to the end of a hydrocarbon chain: 1.
ChemBioDraw 13.0 Nicknames The simplest way to add an atomic symbol to a structure is to type the symbol into a text box. However, you are not limited to entering atoms one at a time. Using nicknames, you can add functional groups, chains, or any other structural feature without drawing each atom. A nickname is an alphanumeric abbreviation that represents a substructure. Nicknames are useful for drawing large structures or structures that repeatedly use similar features.
ChemBioDraw 13.0 To select a nickname to apply to an atom using a hotkey: 1. Point to an atom. 2. Press the hotkey “=” (equal sign). The nickname list appears. 3. Select a nickname from the list. Tip: You can jump to the approximately correct place in the nickname list by typing the first letter of the Nickname. 4. Click OK. Note: Nicknames are tokens and do not flip orientation when applied to the left side of a structure when using Automatic Justification.
ChemBioDraw 13.0 To select the amino acid, double-click the nickname as shown: To expand atom nicknames, 1. Select the selection tool. 2. Select the label to expand or double-click the structure to select all labels in the structure. 3. Go to Structure>Expand Label. Your structure is redrawn in its expanded form. To contract the expanded nicknames: 1. In the biopolymer structure, select the expanded part. 2. Go to Structure>Contract Label. Your structure is redrawn in its contracted form.
ChemBioDraw 13.0 Deleting a keyword When you delete a keyword, all the notes for that keyword are also deleted. 1. In the Annotate dialog box, select the keyword from the Keyword list. 2. Click Delete Keyword. 3. Click OK. Setting preferences You can specify how the captions and labels look each time you use ChemBioDraw 13.0. The changes you specify will be available throughout the application. Go to File>Preferences and click the Building/Display tab.
ChemBioDraw 13.0 To add or remove a terminal carbon label, right-click the atom and select or deselect Show Terminal Carbon Labels. Chemical significance By default, captions are considered to be chemically significant, if possible. For example, if you create a label like "CH3OH”, you will be able to attach bonds to it (and it will be modified appropriately) even though you may have intended it to be a label, not a molecule. Moreover, it’s values are included in the Analysis Window.
ChemBioDraw 13.0 Figure 3.1: a)cyclopropane; b)cyclopentane; c)cycloheptane; d)cyclo hexane chair(1); e)cyclopentadiene; f)cyclobutane; g)cyclohexane; h)cyclooctane; i) cyclo hexane chair(2); j)benzene. To draw a ring: 1. In the Main toolbar, select a ring tool. 2. Click and drag in the document to orient the ring. If you click an atom or bond with a ring tool in an existing structure, the ring is fused to it. You can also use hotkeys to fuse rings. For more information, see "Bond hotkeys" on page 305.
ChemBioDraw 13.0 1. Click one of the Cyclohexane Chair Ring tools. 2. Click+drag in the structure to the orientation you want. Figure 3.2: a)Horizontal orientation; b)Vertical orientation. Aromatic structures Delocalized rings You can draw a resonance delocalized ring using any ring tool except for the cyclohexane chairs. 1. Click a ring tool. 2. Press the CTRL key and drag or click in the document window.
ChemBioDraw 13.0 To draw, click in the document window with either the cyclopentadiene or benzene drawing tool. To shift the orientation so the first bond drawn is a single bond, do one of the following: Shift+drag from the beginning of the first single bond to the end of the single bond. Shift+click in a document window to draw the bond with a Fixed Length. Chains You can draw hydrocarbon chains using either Acyclic Chain tool or Snaking Chain tool.
ChemBioDraw 13.0 1. Select the Acyclic Chain tool. 2. Click an existing atom or an empty area in a document window. The Add Chain dialog box appears. 3. Type the number of carbon atoms in the chain. 4. Click Add. To add another chain of the same length anywhere in a document window, ALT+click where you want the chain to begin. Objects Use the tools on the main toolbar to add shapes to your documents. You can tear off the palettes and place them where you want.
ChemBioDraw 13.0 Figure 3.3: A) Arc adjustment handle Select an arc arrow from the Arrows palette. You can customize arc arrows as easily as straight arrows. Here are some examples: To undo all changes made to an arrow except for the change in length, click the arrow with the same arrow tool. Click an unmodified arrow, or one that has had only its length changed, to reverse its direction. Hollow arrows You can rotate hollow arrows and change their length and width.
ChemBioDraw 13.0 Connecting arrows You can connect a new arrow to an existing arrow at either end or at the midpoint. Note: The terms “left” and “right” in the context menu are relative, and refer to the direction the arrowhead is pointing. For example, to draw a new arrow starting at the midpoint of an existing arrow: 1. Select from the Arrows palette an arrow type for the new arrow. 2. Place your cursor over the midpoint of the existing arrow and hold down the SHIFT key.
ChemBioDraw 13.0 Finally, arrows can be rotated with the Structure Perspective tool as well as the Lasso or Marquee. For more information on Structure Perspective tool, see "Structure perspective" on page 102. Combining these methods lets you draw an unlimited number of arrows. Equilibrium arrows For equilibrium arrows, changing the length changes both arrows proportionately; changing the shape of the arrowhead changes both arrowheads identically. To change the length of one arrow, hold down the ALT key.
ChemBioDraw 13.0 3. On the context menu, choose either Filled, Faded, or Shaded. Drawing elements Drawing elements are simple shapes such as circles and rectangles. To group drawing elements with a structure, go to Object>Group. See "Grouping objects" on page 44. To move an object, select it and click-drag it with a selection tool. See "Moving objects" on page 42. Circles and ovals To draw a circle or oval: 1. Select one of the circle or oval tools. 2.
ChemBioDraw 13.0 Arcs You can draw solid or dashed arcs of different angles: 90°, 120°, 180°, and 270°. To draw an arc: 1. Do one of the following: In ChemDraw Standard, point to an Arc tool and drag in the palette to select the angle. In other ChemBioDraw 13.0 applications, point to the Drawing Elements tool and drag in the tool palette to select the angle. 2. Drag from left to right (for a convex arc) or from right to left (for a concave arc). Editing arcs To resize or rotate an arc: 1.
ChemBioDraw 13.0 Single brackets You can draw a single bracket in any orientation. Select a single bracket tool from the Brackets palette. 1. Point where you want the bracket to start. 2. Drag from one end of the bracket to the other end. Paired brackets Paired brackets can be placed only in a vertical orientation. A rectangle or box defines their position. To draw paired brackets: 1. Select a paired bracket tool from the Brackets palette. 2. Point where you want a corner of the bracket. 3.
ChemBioDraw 13.0 The cursor appears as a hand with a “+” sign inside . However, when the cursor is positioned exactly over the points on the curve, the '+' symbol disappears and the cursor appears as a hand. Changing the Shape of a Curve. Use the square handles at the end of the curve to increase or decrease the length of the curve. Use the endpoints of the direction lines to change the direction of the curve. To change the shape of a curve: Drag the direction lines to create the shape you want.
ChemBioDraw 13.0 arbitrarily shaped arrows to be created. To add color, select a color in the Color menu. Figure 3.5: A freehand curve with different properties; A) A simple curve; B) enclosed; C) filled; D) faded; E) shaded. Selecting objects You should use the Lasso for freehand selection and the Marquee to select rectangular regions. When you select a structure or object, the selection is displayed with a colored frame around it.
ChemBioDraw 13.0 To set one selection tool to behave like the other, click either one of the tools while pressing ALT . To toggle a selection tool and the last drawing tool used, press CTRL+ALT+TAB . Selecting entire structures To select an entire chemical structure, double-click a bond or atom in the structure using a selection tool. If the chemical structure or other object is part of a group, the group is selected. Selecting objects by clicking 1. Select the Lasso or Marquee tool. 2.
ChemBioDraw 13.0 Resizing objects You can resize objects by dragging the resize handle of a selected object or by scaling. To resize a selected object proportionately: 1. Select the objects to resize. The resize handle is located in the lower right corner of the selection rectangle. 2. Point to the Resize handle. The cursor becomes a double-headed arrow. 3. Drag the resize handle until the object is the size you want.
ChemBioDraw 13.0 Shift+drag the Resize handle in the desired direction. Shift modifies the resize operation so that you can distort objects along the X-axis or Y-axis. Rotating objects 1. Select an object to rotate. For objects that can be rotated, the rotation handle appears at the top of the selection rectangle. 2. Drag the rotation handle clockwise or counterclockwise. To rotate an atom label with a structure, press the CTRL key while dragging the structure.
ChemBioDraw 13.0 To move the center of rotation: 1. Select the object. A center of rotation indicator (‘+’) appears in the center of the object, as shown in the figure: Figure 3.6: A) Center of rotation 2. While pressing the ALT key , click and drag the indicator to another location. See figure. Figure 3.7: B)center of rotation moved 3. To rotate the object, click and drag the rotation handle. To reset the center of rotation to its default position, deselect the object.
ChemBioDraw 13.0 To constrain the copy to move only vertically or horizontally while positioning it, hold down the SHIFT+CTRL keys. The info window This window shows the size and position of the pointer and of anything you have selected. To show or hide the window, go to View>Show Info Window. Pointer X and Y display the current mouse coordinates. dX and dY indicate the change in X and Y of a moved selection. Selection. X and Y display the position of a selection. W and H are the width and height.
ChemBioDraw 13.0 Deleting objects To delete selected objects, do one of the following: Press the DELETE key. Go to Edit>Clear. Use the Eraser tool. Joining structures To join two structures so that they share a bond: 1. Select a bond in the first structure. 2. SHIFT+click to select the bond in the second structure. 3. Go to Object>Join. To join two structures so that they share an atom: 1. Position the two chemical structures so that the atoms you wish to fuse are near each other. 2.
ChemBioDraw 13.0 To select grouped objects, move the selection tool over an object in the group until it is highlighted and double-click it. Ungrouping objects To ungroup objects: 1. Select a group. 2. Go to Object>Ungroup or right-click the group and select Group>Ungroup. To create a group so that individual objects cannot be selected (integral group): 1. Select the objects. 2. Go to Object>Group. 3. Right-click the group and select Group>Integral. To restore an integral group to a regular group: 1.
ChemBioDraw 13.0 .To scale the bonds to a new fixed length that you specify, select Scale selected objects so that median bond is option, and type the new median bond length. To scale the object to a percentage of the current size, select Scale by option, and specify the percentage. A value greater than 100% enlarges it; a value less than 100% reduces it. 4. Click Scale. Centering objects To center an object (or group of objects) on the page: 1. Select the object. 2. Go to Object>Center on Page.
ChemBioDraw 13.0 Clean Up Structure The Clean Up Structure command is used to neaten the appearance of molecules by regularizing bond lengths and angles. Graphic objects such as arrows and aromatic circles are not affected. You can use this command to redraw structures that you may have drawn freehand or to neaten structures that you may have imported from another application. For some compounds, the Clean Up Structure command produces a structure that extends beyond the bounds of the page.
ChemBioDraw 13.0 You can also clean up a reaction or a biopolymer. For more information, see "Clean Up Reaction" on page 107 and "Clean Up Biopolymer" on page 65 Check structure You can check the chemistry of a selected structure, part of a structure, or caption (in Formula style) with the Check Structure command. The structure is checked using normal valences and elements, and defined nicknames. To check the valences of all selected atoms in a structure: 1.
ChemBioDraw 13.0 When Display Warnings is disabled for an object: A red box does not appear around the object. Problems are reported by the Check Structure command (Go to Structure>Check Structure). To view a description of the problem, do one of the following: Point at the warning with the mouse to display a tool tip that describes the error. Right-click the warning and choose Explain This Warning. Select the structure and go to Structure>Check Structure.
ChemBioDraw 13.0 Warning Linear Atom Description An unlabeled atom is attached to exactly two identical bonds that create a 180 degree angle.
ChemBioDraw 13.0 BioDraw ChemBioDraw 13.0 includes a variety of tools for drawing metabolic pathways, such as enzymes and receptors. To display the BioDraw toolbars, go to View>Show BioDraw Toolbar. You can also include standard shapes, such as circles, ellipses, and arrows, using the Drawing Elements tool palette or the Arrows tool palette. You can also create custom shapes using the curve tool. You can change the color of an object, change its line and fill properties and also rotate it.
ChemBioDraw 13.
ChemBioDraw 13.
ChemBioDraw 13.0 For more information, see "Templates" on page 113. Customizable objects The table below describes the BioDraw objects in the BioDraw toolbar which can be customized. When customizing a BioDraw object, you must use a selection tool or the same tool used to create it.
ChemBioDraw 13.0 Membrane line 1. Select the membrane line tool from the BioDraw toolbar. 2. Click and drag to draw a membrane line of the size you want or click for the default size. When orienting the membrane, note that you are constrained to 15 degree increments when fixed angles are applied (go to Object>Fixed Angles). To override the constraint, press SHIFT key as you drag. To resize the membrane units, click-drag the adjustment handle at the membrane center.
ChemBioDraw 13.0 The helix protein has four adjustment handles: height, width of the strands, width of the cylinders, and spacing. Figure 4.1: Adjustment handles on a helix protein. A) height adjustment; B) width of strands; C) width of cylinder; D) spacing between cylinders. DNA molecules To create a DNA molecule: 1. Select the DNA tool from the BioDraw toolbar. 2. Drag in the work space or click to draw the default size.
ChemBioDraw 13.0 Ribosomes To draw a Ribosome: 1. On either the Ribosome or BioDraw toolbar, select a Ribosome tool. 2. Click and drag in the workspace until the Ribosome object is the desired size. Having drawn the object, you can modify its appearance. Plasmid maps To draw a plasmid map, you first enter the number of base pairs you want your map to represent and then add markers. A simple pBI plasmid map is shown below. Creating a plasmid map 1. On the BioDraw Toolbar, select the Plasmid Map tool. 2.
ChemBioDraw 13.0 Adding regions Regions represent the fragments in the plasmid. You can add as many regions to you map as you want or none. To add regions: 1. Right-click the plasmid map and select Regions in the context menu. 2. In the Regions dialog box, enter in the Start and End text boxes the base pair numbers for a fragment. For example, if a fragment includes all base pairs from 1 to 1000, type 1 and 1000 in the text boxes. 3.
ChemBioDraw 13.0 To extend an arrow, click and drag its center handle as indicated by the cursor ( ) in the figure above. Enhancing the drawing A plasmid map is like any other drawing. You can add color and add shade to it, change line widths, or modify its text.
ChemBioDraw 13.0 Drawing biopolymers Biopolymers are complex molecular assemblies that adopt precise and defined shapes and structures. Their defined shape and structure are in fact keys to their role. Biopolymers are chain-like molecules made up of repeating chemical blocks and can be very long in length.
ChemBioDraw 13.0 Note: The SHIFT key acts as a toggle. Hence, to enter D-amino acids, press SHIFT while entering a single-letter sequence while in L mode. Alternatively, to enter L-amino acids while in D mode, press SHIFT while entering a single-letter sequence. Note: You can enter three letter amino acids using the "Biopolymer editor" on page 61, and you can use either the keyboard or toolbar to enter residues. DNA tool. Create a DNA chain using labels that represent each of the nucleic acids. RNA tool.
ChemBioDraw 13.0 You can also overwrite and replace the sequence atoms using the residue replacement button in the biopolymer editor. For more information, see "Replacing residues" on page 68. Toggle amino acids Toggle Amino Acid Style AA1<->AA3 option lets you change the amino acid representation from single letter to triple letter and vice versa. For example, 1. Select the sequence. 2.
ChemBioDraw 13.0 If no leaving group is found, after you enter ’)’, a dialog box will prompt you to specify the attachment point. You can expand and contract protected residues just as any other residues. Pasting sequences You can now paste sequences in FASTA format. Since only single-letter IUPAC codes are present in the FASTA format, you must indicate whether this corresponds to a peptide, DNA, or RNA biopolymer sequence.
ChemBioDraw 13.0 Select one of these options: Paste FASTA Peptide Paste FASTA RNA Paste FASTA DNA When you hover your mouse over the residue, a description of the residue and sequence data appears. Paste text strings You can also paste text strings with valid separators. Space, tab, and dash are considered as valid separators. The text string to be copied may be generated within or outside ChemBioDraw. The text strings must contain valid residue names/nicknames, optionally including termini.
ChemBioDraw 13.0 Note: The labels in the text string must correspond to explicit nicknames. Expanding sequences After creating a sequence, you can expand the whole sequence or just specific labels. 1. Select one or more labels in the sequence using lasso tool or marque tool. (Hold down the SHIFT key to select more than one.) 2. Go to Structure>Expand Label. When you expand a residue into its structure, the label appears below the structure.
ChemBioDraw 13.0 Figure 5.1: Two expanded serine residues. The residue on the left has been modified to create homoserine. To contract a label: 1. Using a selection tool, right-click the residue label and select Select Linked Objectsor simply double-click on the label for the expanded residue, and the associated structure will be selected. 2. Go to Structure>Contract Label. Figure 5.2: The contracted label. To ensure that the contracted label includes your changes, you must define a new nickname.
ChemBioDraw 13.0 The residue is selected and you can edit the residue label. Removing residues When you remove a residue, the bonds are automatically re-created between the adjacent labels , and any gaps closed. 1. If the label is expanded, contract the structure back to its label. 2. Select the label, or hover over it. 3. Press DELETE.
ChemBioDraw 13.0 Replacing residues The Biopolymer toolbar has two distinct modes of data entry- Insertion mode and Replacement mode. Insertion mode is the default mode. In the Insertion mode, an orange chevron indicates the position in which the next residue will be inserted. For example, the orange chevron in the sequence below indicates that the next residue will be inserted after the 4th Gly residue.
ChemBioDraw 13.0 2. Click a label you want the new label to be adjacent to. An orange chevron indicates the insertion point. 3. Type the new label. The new label is added to the right of the existing label. Note: To prepend, or insert at the beginning of a sequence, select the terminus atom, select the amino group (protein sequence) or 3’ group (DNA/RNA sequence). Numbering residues You can display the residue ID above any residue. To display the residue ID: 1. Select the residue. 2.
ChemBioDraw 13.0 Branched biopolymers Residue labels typically have two attachment points. However, you can add attachment points so that the sequence branches. For example: When you add an attachment point, you specify the atom in the expanded label to which the bond will attach. To bond from a sequence: 1. Draw a bond starting at the label from which to create a branch. The Modify Nickname dialog box appears, displaying the sequence structure you selected. 2.
ChemBioDraw 13.
ChemBioDraw 13.0 V Val Valine W Trp Tryptophan Y Tyr Tyrosine The tables below list the three letter codes for non-specific and non-proteinogenic amino acids.
ChemBioDraw 13.0 You can create a crosslinked peptide such as insulin, using the biopolymer tool and bond tool. Branched peptides A branched peptide is formed where a residue has multiple possible leaving groups. For example, Arg has two amino groups and Asp has two carboxyl groups. A polymerization reaction could potentially take place at either of these groups, or at both.
ChemBioDraw 13.0 2. Using the solid-bond tool, drag from the lower chain's Gly-3 to the upper chain's Arg-3. The terminal hydrogen on the lower chain is removed and the branched peptide appears as: If the residues does not have leaving groups that can be automatically found, the Modify nickname dialog appears and you need to manually define the third attachment point. Consider the following example, 1. Draw two biopolymer chains as shown below: 2.
ChemBioDraw 13.0 Insulin consists of two chains, an A chain and a B chain, connected by disulfide bridges. A chain GIVEQCCTSICSLYQLENYCN B chain FVNQHLCGSHLVEALYLVCGERGFFYTPKT You can build these chains either by copying and pasting the above text using the Paste Special>FASTA Peptide command or by using the Biopolymer toolbar to build each chain.
ChemBioDraw 13.
ChemBioDraw 13.0 Tutorials The tutorials illustrate fundamental drawing techniques. Each tutorial introduces new techniques, or variations of techniques from previous tutorials. We therefore suggest that you follow the tutorials in order. Before you begin, review "Conventions used in this guide" on page 1 to familiarize yourself with the terminology. ChemBioDraw 13.0 checks for correct chemical syntax as you draw.
ChemBioDraw 13.0 Adding atom labels 1. Using the Text tool, click the end of the double-bond shown below. A text box appears at the end of the bond. 2. Type an uppercase O in the text box. 3. Close the text box by either pressing the Esc key or choosing another tool. Adding a caption We also want to name the molecule. 1. Using the Text tool, click below and to the left of the structure. A text box appears. 2. In the text box, type “2-propanone”. 3. Press Esc or choose another tool.
ChemBioDraw 13.0 Figure 6.1: To change the bond order, type ‘1’. 5. To create the double bond in the second ring, either hover the mouse over the bond and type ‘2’ or click it. 6. Using the bond tool, click the carbon atoms circled in the figure below. Three new bonds will appear. 7. Hover your mouse over one of the bond shown below and type ‘2’. Do the same for the other bond.
ChemBioDraw 13.0 8. Hover the mouse over the right-most terminal carbon and type the letter ‘o’ to create the ketone functional group. 9. To connect the left terminal carbons, select the solid bond tool and click-drag a bond from one carbon to the other. The structure is complete.
ChemBioDraw 13.0 Figure 6.2: Fischer projections To draw the first bond: 1. Click the Solid Bond tool. 2. Point in the document window. Drag downward to draw the first bond. 3. Point to the lower atom, and drag downward again to draw the second bond. The red wavy box appears because Show Chemical Warnings is selected. We will keep it selected for now. 4. Repeat step 3 there are five bonds. Figure 6.
ChemBioDraw 13.0 Note: When you drag the pointer along the length of the bonds, the pointer alternates between an arrow and a cross. The arrow indicates you are pointing over the center of a bond, and the cross indicates you are pointing to an atom. Add horizontal bonds to the second atom in the string of bonds you created: 1. To add a horizontal bond, point to the uppermost Chemical Warning box and click it. Note that the red wavy box disappears when you add a bond. 2.
ChemBioDraw 13.0 Figure 6.6: Adding repeating atom labels Tip: Double click an atom with the text tool to repeat the last label. 3. Click one of the remaining atoms and type O. 4. Double-click the remaining atoms to repeat the label. Figure 6.7: Completing the drawing View the basic properties of the structure and paste the information into your document: 1. Click a selection tool to select the last structure drawn. If the structure is not selected, double-click the structure. 2.
ChemBioDraw 13.0 Note: If you are following the tutorials in order, ChemBioDraw 13.0 will remember your last drawing used the ACS style sheet and open it as the default.This step resets the default to New Document. Draw a ring: 1. Click the Cyclohexane Ring tool. 2. Click in an empty area of a document window. A cyclohexane ring appears. Rotate the ring: 1. Go to Edit>Select All (or type CTRL+A). 2. Go to Object>Rotate (or type CTRL+R) 3.
ChemBioDraw 13.0 Enlarge the ring: 1. Go to Edit>Select All (or type CTRL+A). 2. Click-drag the ring a corner adjustment handle increase the size of the ring to 150%. A dialog box appears, asking you whether you want to scale the drawing and text settings. 3. In the dialog box, click No. Add vertical bonds: 1. Click the Solid Bond tool. 2. Point to the atom shown in the figure below and drag upward to create a bond. 3. Point to the same atom, and drag downward to create another bond. 4.
ChemBioDraw 13.0 Figure 6.8: Adding the OH labels 3. Move the pointer to the other atoms as shown, and triple-click to repeat the atom label. Tip: If the drawing is too small to place the labels, go to View> Magnify to enlarge it. Add the CH2OH label: 1. Triple-click the upper atom of C5. 2. Press ENTER to open the atom label text box. Type CH2 before the OH. Change the type of the front bonds: 1. Click the Bold Bond tool.
ChemBioDraw 13.0 2. Click the bond shown in the figure. 3. The cursor changes to a bold arrow as you point to the bond. 4. Click the Wedge bond tool. 5. Click each ring bond adjacent to the bold bond. For each bond, point slightly off center in the direction that you want the wide end of the wedge to be oriented and click. Tip: If you move the pointer too far, the highlight box disappears. If placing the pointer is difficult, go to View>Magnify.
ChemBioDraw 13.0 Draw ethane: 1. Click the Solid Bond tool. 2. In the document window, click-drag downward to create the first bond. 3. Click the atom at the bottom of the bond to add a second bond. 4. Click the bottom atom again to add a third bond. 5. Hover the mouse over the end of each bond (without clicking) and type H to add the hydrogen atoms. Duplicate the structure: 1. Click a selection tool. The last structure you drew is selected. 2.
ChemBioDraw 13.0 Drawing the Newman projection In this step, you draw the hollow circle that is particular to Newman projections. 1. Click the Orbital tool, and select the s (Open) orbital. 2. Point to the left center carbon and click-drag outward. The size of the orbital is constrained just as bonds are. The constraint is based on a percentage of the Fixed Length setting in the Drawing tab of the Document settings dialog box. Note: Orbitals are not automatically grouped with the structure.
ChemBioDraw 13.0 Note: If chemical warnings are turned on, a red warning box appears when you overlay the structure, because the carbon atoms overlay the C-C bond. To turn off the chemical warning, deselect Chemical Warnings in the View menu. To disable this type of warning, go to Preferences and deselect Atoms Near Other Bonds in the Warnings tab. 3. Release the mouse button and click outside the Selection Rectangle to deselect the structure.
ChemBioDraw 13.0 5. Point to the atom shown below and click twice to create two bonds. 6. Pointing to the bond shown below, right-click, and select Double>Plain from the context menu. 7. Click the Wedged Bond tool, point to the atom below, and then click. Adding atom labels 1. With the Text tool selected, click the atom shown below, and then type 'NH2' in the text box that appears. 2. With the Text tool selected, click the atom shown below, and then type 'O' in the text box that appears.
ChemBioDraw 13.0 3. With the Text tool selected, click the atom shown below, and then type 'OH' in the text box that appears. Displaying stereochemical markers We now display the stereochemical markers, (R) and (S) for the two isomers. To add the markers: 1. Select the entire structure with the Lasso or Marquee tool. 2. Go to Object>Show Stereochemistry. The S marker appears. 3. Select the structure and go to Object>Flip Horizontal. The R marker appears. 4.
ChemBioDraw 13.0 The Wedged bond becomes hashed and the (R) stereochemistry is preserved. Tutorial 7: Templates ChemBioDraw 13.0 comes with an extensive template library of pre-drawn structures and images. You can use a template to either start a new drawing or to modify one that already exists. In this tutorial, we use the phenanthrene template to create peroxydibenzene. The template and final drawing are shown below: To add the template for phenanthrene: 1. Go to File>Open Style Sheets>New Document. 2.
ChemBioDraw 13.0 2. Click the bottom bond in the center ring. 3. Click the double bond at the top of the ring. It is now a single bond. 4. In the Main toolbar, select the Text tool. 5. Select one of the carbon atoms in the hydrocarbon chain (what was the middle ring). 6. Type O to change it to an oxygen atom. 7. Select the other carbon atom and change it to an oxygen. Peroxydibenzene is now shown.
ChemBioDraw 13.0 Advanced drawing techniques The advanced features help you save time or let you perform functions that simply can’t be accomplished using the basic tools. For example, you can see your drawing as 3D models or create stereoisomers at the click of the mouse.
ChemBioDraw 13.0 Figure 7.1: A) The mitochondrion structure in its default color; B) The structure colored blue as a group; C) The structure colored blue as an integral group. The new color applies to all structures in the group, even if the original colors of the objects in the group are not the same. See example below: Figure 7.2: A)The structure colored pink as an integral group; B)The structure colored pink as a group.
ChemBioDraw 13.0 Note: If the area of the structure you contract contains errors, an error dialog box appears. Click Ignore to view other errors. Click Ignore All to ignore all errors or Stop to end the contract process. Expanding labels If your structures contain defined nicknames, long atom labels, or contracted labels, ChemBioDraw can restore your structures to the fully expanded form. To expand atom labels: 1. Select a selection tool. 2.
ChemBioDraw 13.0 Expanded: Adding a label of multiple atoms 1. Using the text tool, click an atom in the structure where you need to place the label. 2. Type the formula (such as “CH2NHCH3”). 3. Using a selection tool, select the formula. 4. Right-click the formula and select Expand Label or go to Structure>Expand Label. You can also use the Expand Label tool in the Structure toolbar. Figure 7.3: Adding bonds to a label You can determine the orientation of the resulting bond by dragging.
ChemBioDraw 13.0 Adding from the start of an atom label creates bonds that try to attain the chain angle setting in the Drawing Settings dialog box. If that angle cannot be attained, the next best angle is used. Attachment points You can draw polyhapto structures such as ferrocene ((Cp)2Fe), or abbreviated notations for different positional isomers of a compound, using attachment points. The procedure is similar, and in both cases, the structure retains chemical significance.
ChemBioDraw 13.0 For example, you can explicitly draw the three isomers of dibromobenzene as shown below. Alternately, you can express all three isomers as a single parent structure by using a variable attachment as shown below. Abbreviated notation for: Figure 7.5: Isomers of dibromobenzene To add a variable attachment point to a structure: 1. Select all or part of the structure. 2. Go to Structure>Add Variable Attachment. 3. Point to the asterisk in the structure and drag to draw a bond.
ChemBioDraw 13.0 Note: After you draw a bond from an attachment point, the asterisk disappears. To view an attachment point, position the cursor over it with either a bond tool or a selection tool. Atom numbering You can add sequential numbers or letters to the atoms in your structure. You can add: Numbers (1, 2, 3, and so on) Text ending with a number (atom1) Greek letters for alpha, beta, and so on Letters (a, b, c, and so on) The default indicator is numbers.
ChemBioDraw 13.0 Note: When you type a new indicator, the counter resets to the new style and you can continue numbering in that style with the standard means. For example, if you type a in a text box, then point to another atom and use the context menu or hotKey, the atom will be labeled b. Switching to another structure resets the counter. 3. To edit the atom number style, select the atom number with the Text tool and use the Text menu or Text formatting toolbar to change the style.
ChemBioDraw 13.0 1. Select the structure with either a selection tool or the Structure Perspective tool. 2. With the Structure Perspective tool, click-drag the selected structure. Place the cursor inside the marked rectangle and drag in any direction. Tip: Use SHIFT+drag to limit the rotation to the X or Y axes only. You can also select part of a complex molecule and rotate it around a particular bond. Note: You cannot apply structure perspective to orbitals.
ChemBioDraw 13.0 You can reposition the formula and mass displays or delete them. Synthesis and retrosynthesis ChemBioDraw 13.0 includes two tools to help you draw synthesis reactions. The Synthesis tool draws synthesis reaction based on a product structure that you specify. Alternatively, the Retrosynthesis tool draws the reaction with the product on the left and an arrow pointing to the reactants. These tools are in the fragmentation tools palette of the main tools palette.
ChemBioDraw 13.0 Drawing an arrow Starting with 2-propanone (see "Tutorial 1: Drawing a structure" on page 77), draw the reaction arrow: 1. On the Arrows toolbar, click the third arrow from the left in the top row as shown below: 2. In the document window, click and drag the mouse horizontally to the right of the 2-propanone structure. The arrow appears. 3. Select the Text tool. 4. Click above the arrow. A text box appears. 5. Type OH and press ESC.
ChemBioDraw 13.0 Copy the structure: 1. Select the 2-propanone structure and its caption. 2. Press and hold the CTRL key. The hand pointer with a plus sign indicates that you are in the duplication mode of a selection tool. 3. Drag the selection rectangle to the right and release the mouse button. Note: To keep the copy aligned with the original, hold SHIFT while dragging. Modify the duplicate structure: 1. Select the Solid Bond tool. 2. Click the far right bond of the copied structure (Figure below). 3.
ChemBioDraw 13.0 Replace the product caption: 1. Select the caption with the Text tool and type 4-hydroxy-4-methyl-2-pentanone, press the ENTER and type 1 mole. 2. Using the Text tool, add 2 Mole to the caption for the reactant. Clean Up Reaction After you draw a reaction, you can clean the reaction using the Clean Up Reaction command under the Structure menu.
ChemBioDraw 13.0 Figure 7.8: The reaction after applying the Clean Up Reaction command Note: The Clean Up Reaction is available only for single-step reactions. Note: The Clean Up Reaction command is available only for reactions with straight arrows. In case of arrows with curvatures the Clean Up Reaction command is disabled.
ChemBioDraw 13.0 1. Go to View>Show Reaction Interpretation. 2. Hover your cursor over the reaction arrow. For a reaction to be interpreted: Each reactant and product must contain at least one atom. Each reactant and product must be described using a single label. Multiple reactants and products should be linked by a “+” sign. Reaction conditions must reside completely within the left and right boundaries of the reaction arrow. The reaction cannot include a curved arrow.
ChemBioDraw 13.0 2. Click+drag the mouse from the source object to the target object and release the mouse. A half-head arrow signifying only one electron transfer appears, such as: Figure 7.10: Example of radical pushing You can delete the electron transfer arrow by either selecting or hovering over the arrow and pressing DELETE. You can modify the electron transfer arrow shape by using either the Arrow tool or the Electron Pushing Tool.
ChemBioDraw 13.0 Note: If a catalyst or condition label is above the reaction arrow, right+click the label and deselect Interpret Chemically in the context menu before creating the grid. To enter data in the grid: 1. Set the limiting compound. If the default setting is incorrect, right-click the word ‘No’ in the limiting row, and select Set Limiting from the context menu. 2. Select the Text tool, and click where to enter the data. Enter values for all reactants, as applicable.
ChemBioDraw 13.0 Value Comments Molarity Default units: M Density Default units: g/ml After you enter the minimum amount of information the values are calculated. The values are automatically recalculated when you enter a new value, edit input, or modify the reaction. To edit input, click the required input and enter the new value. For example consider the following table: If you edit the value in the Reactant Moles field for the reactant in the table to 30.00 mol, the rest of the table is updated.
ChemBioDraw 13.0 To hide a column, right -click the column and select Hide Column from the context menu. To display hidden rows or columns, select Show All from the context menu. To change the color of the text, select Color from the context menu. Templates ChemBioDraw 13.0 includes a library of templates. You can use a template either as a starting point for a new drawing or to add to an existing drawing. A palette is a set of templates. The templates you define are not limited to atoms and bonds.
ChemBioDraw 13.0 Customizing templates You can modify template palette and create your own palette. When you create a palette, a set of empty template panes appear above the document window. After you save your palette, it contains the templates you have drawn. You can then select your palette from the palette list in the Templates tool. You can also store templates as groups, or even integral groups, so that they are treated as an individual entity within the documents into which they are dropped.
ChemBioDraw 13.0 3. Specify a new name for the template in the Content text box. 4. Click OK. 5. Click Save. The annotation appears as a tooltip, when you point to the annotated template. Deleting a template 1. Select the template pane for the template to delete. 2. In the document window, select the entire drawing. 3. Go to Edit>Clear. 4. Go to File>Save.
ChemBioDraw 13.0 if you expand the structure H-Leu-OH, the hydrogen is bonded to the first attachment point in leucine and the hydroxyl group to the second. For more information, see "Using nicknames" on page 22. We will use b-alanine structure to show how to define a new nickname: 1. Draw the b-alanine structure. 2. Draw a bond to the NH2 group. 3. Delete the label on the OH group. 4. Using the Attachment Point tool, add an attachment to the N-terminus. 5. Add an attachment to the C-terminus. 6.
ChemBioDraw 13.0 As in ChemBioDraw 12.0, Nicknames can also be defined by carving a substructure out of a structure. Nicknames and atom labels If you use a nickname that is the same as an element name, a message indicates that the element is replaced with the nickname. For example, using Ac for an acetyl group replaces the element Actinium. The Check Structure command recognizes the label as an acetyl group rather than Actinium.
ChemBioDraw 13.0 Incorrect Correct a b ChemScript ChemScript is the cheminformatics Software Development Kit (SDK). It contains the programming algorithms that are common throughout PerkinElmer Informatics products. With enough knowledge writing software code, you can apply ChemScript to create your own scripts to use with ChemBioOffice applications. ChemBioDraw Ultra also includes a library of sample scripts for you to use. Go to File>ChemScripts and select an option.
ChemBioDraw 13.0 Launch external applications from ChemBioDraw. Automate workflow from ChemBioDraw. The input data for the script consists of CDXML data from the currently active document in ChemDraw. If you select a portion of the document, then only the selected part of the document will be used as input to the script. You can apply scripts to chemical structures and reactions.. You can place scripts in the Scripts directory for easy usage.
ChemBioDraw 13.0 Struct=Name ChemBioDraw 13.0 incudes two features for generating structures and chemical names—Name>Struct and Struct>Name. Collectively, these features are called Struct=Name. Struct>Name generates the names of chemical structures using the Cahn-Ingold-Prelog rules for stereochemistry. Using this option, you can generate the name of structures you have drawn. Name>Struct lets you convert chemical names into their corresponding chemical structures.
ChemBioDraw 13.0 Non-ringed structures Isolating and naming the functional groups Identifying the base chain of the molecule Identifying and building substituents Nomenclature of groups cited only by prefixes Heteroacyclic compounds Naming of substituent groups Locants Name generation (alphabetization, punctuation, etc.
ChemBioDraw 13.0 Figure 8.1: An example of a ring assembly structure: 1,1':2',1''-terphenyl. Fused ring systems Struct>Name supports fused ring systems of two or more rings such as the structure below. Figure 8.2: cyclopenta[ij]pentaleno[2,1,6-cde]azulene is a fused ring system. Bridged fused ring systems ChemBioDraw 13.0 supports bipodal (both bivalent and polyvalent) simple acyclic (chained) homogeneous (atoms of only one element) independent bridged fused ring systems. For example: Figure 8.
ChemBioDraw 13.0 Polymers Polymer structures cannot be expressed by SMILES. However, Struct>Name supports many homopolymers, copolymers and alternating polymers. For example: Figure 8.4: polyaziridine compound with sulfamic acid (1:1) Other compounds Phosphorous and Arsenic compounds Si, Ge, Sn, and Pb compounds Boron compounds Organometallic compounds Struct>Name generates names with proper CIP stereochemistry descriptors.
ChemBioDraw 13.0 Sulfones and chalcogen analogs Isotopically modified compounds Radicals, ions, and radical ions Auto update You can include chemical properties, including the chemical name and analysis, in a caption, and the caption content will update automatically when you modify the structure. For more information on adding chemical properties to captions, see "Analysis data" on page 26. To toggle the auto-update feature: 1. Point to the caption. 2. Right-click and select Auto-update.
ChemBioDraw 13.0 Converting clipboard names To paste a name on the clipboard as a structure: 1. Click in the document window. 2. Go to Edit>Paste Special>Name as Structure. The structure appears in your document. Converting captions You can convert a caption to a structure. 1. Select the caption. 2. Go to Structure>Convert Name to Structure.
ChemBioDraw 13.
ChemBioDraw 13.0 Chemistry features Structure analysis You can display the chemical formula, exact mass, molecular weight, m/z, and elemental analysis for the entire document, a structure, or a part of a structure using the Analysis window. Values for selected objects in the document window are shown. If no structure is selected in your document, values for the entire document are shown. You can have this window open as you draw in the document.
ChemBioDraw 13.0 2. Go to View>Show Analysis Window. The analysis windows displays values for the parts of the drawing you select or the entire drawing if nothing is selected. 3. (Optional) Select Paste to add the analysis information to your drawing. The information appears as a caption that you can edit. Figure 9.1: Structural analysis The information updates as you edit the structure. You can show or hide the information: 1. Using any tool, right-click the caption. 2.
ChemBioDraw 13.0 Stereochemistry ChemBioDraw 13.0 calculates the absolute stereochemistry according to the Cahn-Ingold-Prelog (CIP) priority rules. For more information, see "Cahn-Ingold-Prelog" on page 296. Only tetrahedral and double-bond stereochemistry are supported, and only non-racemic stereochemistry is interpreted. Stereochemical indicators for aromatic bonds are not displayed. ChemBioDraw uses this notation: (R), (S) Standard tetrahedral stereochemistry.
ChemBioDraw 13.0 ChemBioDraw updates the stereochemistry indicators as you change the drawing. Hiding indicators 1. Select the indicator to hide. 2. Right-click and select Hide Indicator. Formatting indicators To change the font style: 1. Select the indicator. 2. Right-click and select the Style from the context menu. To apply parentheses to stereochemistry indicators: 1. Go to File>Preferences. 2.
ChemBioDraw 13.0 To indicate an exact location: 1. Select the indicator. 2. Right-click and choose Position. The Position Indicator dialog box appears. 3.
ChemBioDraw 13.0 Figure 9.2: beta-Cypermethrin Two stereo-centers have the &1 designation because of their fixed relative configuration: when one is (R) the other must be (S). As a result, they form a group. The third stereocenter varies independently and is designated &2. Group numbers are incremented automatically. To see all the beta-cypermethrin stereoisomers, go to File>Open Samples>b-Cypermethrin. To indicate stereochemistry for a group: 1. Select all atoms in the group using SHIFT+click. 2.
ChemBioDraw 13.0 Display the Info window to view the orbital’s length and angle relative to the X-axis while you draw it. To constrain the length and angle of an orbital, go to Object>Fixed Lengths or Fixed Angles. Note: Orbitals are not normally part of the structure they are drawn near and are not selected when you double-click a bond, atom, or atom label with a selection tool. To group the orbitals with the structure, go to Object>Group. See "Grouping objects" on page 44.
ChemBioDraw 13.0 d-orbitals The d-orbital is shown below: To draw a d orbital(‘dxy’): 1. Hold down the mouse button over the Orbital tool and drag to select the d-orbital tool from the palette. 2. Click an atom where the node of the orbital is to be attached. To draw a dz orbital: 2- 1. Hold down the mouse button over the Orbital tool and drag to select the dz2-orbital tool from the palette. 2. Click an atom where the node of the orbital will be attached.
ChemBioDraw 13.0 Radical Use the radical symbol to indicate a single non-bonded electron. 1. Hold down the mouse button over the Chemical Symbols tool and drag to select the radical from the palette. 2. Click and drag the atom to where you want the radical symbol. Note: The lone pair symbol is interpreted as a diradical when it is placed next to an unlabeled carbon atom. Radical cation and radical anion Use the charge radical symbols to represent radicals that are charged. 1.
ChemBioDraw 13.0 Rotating a symbol You can rotate the radical anion, cation, and lone pair symbols around the same end from which they were originally drawn. For example, the radical cation symbol is rotated and resized from the charge. The Info window shows the angle that one of the ends of a symbol makes with the X–axis as you rotate. To rotate a chemical symbol: 1. Select the chemical symbol. 2. Drag the rotation handle on the chemical symbol. See "Rotating objects" on page 41.
ChemBioDraw 13.0 CLogP/CMR M G Melting point Gibbs free energy MR About Molecular Networks *MOSES.pKa, MOSES.logS and MOSES.logP for predicting acid dissociation constants, aqueous solubility and octanol/water distribution coefficients of chemical compounds are computational calculator modules based on Molecular Networks' cheminformatics platform MOSES. MOSES is developed, maintained and owned by Molecular Networks GmbH, Erlangen, Germany. For further information please visit www.molecular-networks.
ChemBioDraw 13.0 Critical pressure Reported in bars, this is the least applied pressure required at the critical temperature to liquefy a gas. Critical temperature Reported in Kelvin, this is the temperature above which a gas cannot be liquefied, regardless of the pressure applied. Critical volume Reported in cm3/mol, this is the volume occupied by one mole of a substance at the critical temperature and pressure. CLogP/CMR Use CLogP to calculate n-octanol/water partition coefficient (log Pow).
ChemBioDraw 13.0 Heat of formation Reported in KJ/mole, the heat of formation is the increase in enthalpy resulting from the formation of one mole of a substance from its constituent elements at constant pressure. Henry’s law constant A unitless value, Henry's Law Constant can be expressed as: Where ‘p’ is the partial pressure of the solute in the gas above the solution, ‘c’ is the concentration of the solute and ‘kH,pc’ is a constant with the dimensions of pressure divided by concentration.
ChemBioDraw 13.0 Where ‘T’ is the temperature at the melting point, ‘DS’ is the change in entropy of melting, and ‘DH’ is the change in enthalpy of melting. MR The Molar Refractivity is estimated by Crippen's fragmentation, and Viswanadhan's fragmentation method. Additional empirical LogP data appears for selected substances in the report file. pKa pKa is the negative log of the acid dissociation constant K . It describes the tendency of compounds or ions to disa sociate in solution.
ChemBioDraw 13.0 Connolly Solvent Accessible Surface Area L Polar surface area Connolly Solvent-Excluded Volume LogP R E M Radius Exact Mass Mass S Property predictions in Chem3D Chem3D lets you build, analyze and compute properties very easily. In addition to analyzing structures to calculate mass and formula, predicting numerous physical properties, you can also perform calculations for molecular topology. A list of properties available in Chem3D is listed in the table below.
ChemBioDraw 13.0 Exact Mass Mass RMS Force F Melting Point S Formal Charge Mol Formula SCF Energy Frequencies Mol Formula HTML Shape Attribute Mol Refractivity Shape Coefficient ChemBioFinder properties The properties listed below can be calculated in ChemBioFinder Ultra for ChemBioOffice 2012. For more information on these properties and how to calculate them, see the ChemBioFinder online help.
ChemBioDraw 13.0 3D viewing As you create your drawing, you may be curious to see it in three-dimensions. There are two features in ChemBioDraw that lets you do just that. Note: ChemBio3D must be installed on your computer to preview structures in three dimensions. 3D model Use a 3D model to paste a 3D version of the structure into your drawing. 1. Select the structure. 2. Go to Edit>Get 3D Model. The 3D structure appears in the document window. To view the model in ChemBio3D, double-click it.
ChemBioDraw 13.0 With the preview window open, you can change the structure’s appearance, in either the document window or the preview window. In the document window With the preview window open, you can still change your drawing in the document window. The preview window updates to reflect the changes. In ChemBio3D preview The preview window offers several options to view structures. Figure 9.4: A)Launch Chem3D; B)Display mode; C)Select; D)Translate; E)Rotate; F)Zoom; G)Spin; H)Rock.
ChemBioDraw 13.0 Launch Chem 3D. The structure will appear in ChemBio3D as a model that you can edit. Display Mode. Choose display options for the model: wire frame, stick, ball & stick, cylindrical bonds, and space filling. Select. Select the structure or parts of it. Translate. Move the structure. Rotate. Rotate the structure in three dimensions (the image rotates only in the ChemBio3D Preview). Zoom. Enlarge or reduce the apparent size of the structure. Spin.
ChemBioDraw 13.0 If you want to... then... 2. Right-click in the plate. 3. Select the appropriate action. 4. (Optional) To delete a lane, click it with the Eraser tool. Move a spot. Drag the spot. The Rf displays as you drag. Duplicate a spot. CTRL+dragthe spot to a different lane. Delete a spot. Click the spot with the Eraser tool. If you erase all spots in a lane, the lane will be deleted. Display or set the Rf for a spot; add a custom spot. 1. Right-click on a spot. 2.
ChemBioDraw 13.0 If you change the Rf the spot will move to the new position indicated. If you edit the Rf to have different precision, that precision will be preserved. Resizing spots You can resize spots by holding down the SHIFT key while pointing at an edge of the spot. Drag the left or right sides of the spot to adjust the width only. Drag from the top to adjust the height. Drag from the bottom to adjust the tail. Drag from any of the other four corners to scale all three values.
ChemBioDraw 13.0 Option Action Set Range... A dialog box prompting for the new range appears. The expected values entered in this dialog are always “kDa”. The default value for range is 10 to 10,00,000 (Mass), 1 to 6(Log), and 0 to 1(Distance). When you change the range, the bands that fall out of range are hidden. Add Bands... A dialog box prompting for the mass of the new bands to be created in the selected lane appears. Space is used as a separator. Only numbers are allowed.
ChemBioDraw 13.0 Option Action Show size. The current value of the band appears above it. The value is always shown on top of the band, and is always bound to it. If you drag it to another position, a tether appears between the band and the text. You can move the marker label by pressing the ALT key. Set Size. A dialog box prompting for the new mass(size) of the band appears. The band will be automatically moved according to its new value.
ChemBioDraw 13.0 ChemNMR Using ChemNMR, you can estimate and display proton and Carbon-13 chemical shifts for a selected molecule. As with ChemBioDraw, you can also use ChemBio3D to predict NMR. ChemBio3D includes several interfaces to computational chemistry packages which predict NMR. Some packages predict IR spectra and other spectra as well. For more information on ChemBio3D packages which have NMR predictions, and their available parameters, see Chem & Bio 3D user guide.
ChemBioDraw 13.0 "NMR references" on page 156 (source citations) NMR shifts ChemNMR estimates chemical shifts for all hydrogen or carbon atoms for which additivity rules are available. Following a hierarchical list, it first identifies key substructures of a molecule. A substructure provides the base value for the estimated shift. For example, benzene would be the key substructure of trinitrotoluene.
ChemBioDraw 13.0 The change in the frequency is not indicated in the output NMR spectra, and the modified frequency value remains set even after you exit ChemDraw. Hence it is advised to set the frequency back to 300 MHz to avoid confusion in subsequent NMR predictions. Assigning structures to spectra ChemBioDraw Ultra lets you assign structures to spectra. You can then display the structure associated with a specific peak by placing the pointer on that peak. 1. Open a spectral file. 2.
ChemBioDraw 13.0 > 2,9.61,0.0 > 3,8.92,0.0 The correction data for each molecule must appear after the molecule’s structural data. For example, if your SDF file includes benzene, the NMR data must immediately follow the benzene structural data. Updating the ChemNMR database Once you have an SDF file that contains the supplementary, follow these steps to update the ChemNMR database: 1. Exit ChemBioDraw. 2. Locate the ChemBioDraw ChemNMR directory.
ChemBioDraw 13.0 4.6062 -1.3275 0.0000 C 0 0 0 0 0 0 0 0 0 0 0 0 4.6062 -3.9825 0.0000 N 0 0 0 0 0 0 0 0 0 0 0 0 3.4547 -1.9992 0.0000 C 0 0 0 0 0 0 0 0 0 0 0 0 3.4547 -3.3267 0.0000 C 0 0 0 0 0 0 0 0 0 0 0 0 6.9094 -1.3275 0.0000 N 0 3 0 0 0 0 0 0 0 0 0 0 8.0609 -1.9992 0.0000 O 0 5 0 0 0 0 0 0 0 0 0 0 6.9094 -0.0000 0.0000 O 0 0 0 0 0 0 0 0 0 0 0 0 2.3031 -1.3275 0.0000 C 0 0 0 0 0 0 0 0 0 0 0 0 2.3031 -0.0000 0.0000 C 0 0 0 0 0 0 0 0 0 0 0 0 1.1516 -1.9992 0.0000 C 0 0 0 0 0 0 0 0 0 0 0 0 1.1516 -3.
ChemBioDraw 13.0 M ZZC 10 7 M ZZC 11 8 M ZZC 12 11 M ZZC 13 12 M END > 1 > d6-DMSO> 2,9.61,0.0> 3,8.92,0.0> 6,9.01,0.0> 10,3.11,0.0> 11,1.16,0.0> 5$$$$ TH> d6-DMSO> 2,9.6,0.0> 3,8.91,0.0> 6,9.11,0.0> 10,2.75,0.0> 11,1.17,0.0> 12,2.41,0.0> 6$$$$ ACD/Labs07190711112D 15 15 0 0 0 0 0 0 0 0 16 V2000 7.1683 -1.9521 0.0000 C 0 0 0 0 0 0 0 0 0 0 0 0 7.1683 -3.2484 0.
ChemBioDraw 13.0 In case of 13C NMR, it estimates over 95% of the shifts with a mean deviation of -0.29 ppm and standard deviation of 2.8 ppm. NMR references Sources for ChemBioDraw 13.0 NMR data include the following publications: Fürst, A.; Pretsch, E. Anal. Chim. Acta 1990, 229, 17. Pretsch, E.; Fürst, A.; Badertscher M.; Bürgin, R.; Munk, M. E. J. Chem. Inf. Comp. Sci. 1992, 32, 291-295. Bürgin Schaller, R.; Pretsch, E. Anal. Chim. Acta 1994, 290, 295. Bürgin Schaller, R.; Arnold, C.; Pretsch, E.
ChemBioDraw 13.0 ChemDraw/Excel ChemDraw/Excel is an add-in for MicrosoftExcel for Windows. You can add chemical structures and other data from ChemBioDraw 13.0 or a ChemBioFinder database to an Excel worksheet. Afterward, you can calculate any of a vast array of structural properties or examine search results from an SDfile. It has the same search features as ChemFinder. When you install the add-in, a ChemOffice menu is added to the Excel menu and a toolbar appears.
ChemBioDraw 13.0 Note: To import CFW files into Excel, save them with the “allow CAL/OLE Automation access” security setting checked. See “Setting Security Options” in the ChemBioFinder user guide for details. Note: Structures saved as ChemFinder XML files can be imported into Excel using the add-in. When you import a table, structure data are transformed into structure drawings in the first column, and all other fields are imported in separate columns. To import a table: 1.
ChemBioDraw 13.0 2. Go to ChemOffice13>Import/Export>Export Table. 3. In the Save Table To dialog box, type the file name and click Save. The status bar displays the progress. Synchronizing tables You can synchronize a table in your worksheet with a ChemBioFinder database, for example, a .CFX file. On synchronizing a ChemDraw/table with a ChemBioFinder table, fields (and their data) in the ChemBioFinder table that are not in the Excel table are added to the Excel table.
ChemBioDraw 13.0 Adding structures You can add chemical structures to a worksheet from any file format that ChemBioDraw 13.0 supports. ChemDraw/Excel assigns the chemical formula as structure name which can be changed by using the Name Molecule command. The simplest way to insert a new structure in a cell is by double-clicking a cell. 1. Create a ChemOffice worksheet. 2. Double-click in a cell. ChemDraw/Excel displays a dialog asking you if you want to add a structure to the cell. 3. Click YES.
ChemBioDraw 13.0 3. Go to ChemOffice13>Convert>Inchi to Molecule. If the cell does not contain a valid Inchi string, an error message appears. Adding structures by name You can type or paste chemical names into cells and convert the names to structures. 1. Enter the names into cells. 2. Select the cells to convert. Tip: You can also convert names generated from Excel formulas. 3. Select ChemOffice13>Convert>Name To Molecule.
ChemBioDraw 13.0 R-Group analysis Opening a database Before searching, you must open a structure database. 1. In Excel, go to ChemOffice13>New ChemOffice Worksheet. 2. Go to ChemOffice13>Import/Export>Import Table or Import ChemFinder list and select the file to import. Normal searches Use a normal search to find full structures and substructures that match the one you define in the search dialog box. 1. Select a cell containing the label Structure. 2. Go to ChemOffice13>Search>Normal.
ChemBioDraw 13.0 R-Group analysis An R-group analysis returns all molecules in the query database that include a template structure that you provide. For example, assume you want to find all molecules that include toluene in its structure, such as p-cresol or o-xylene (assuming your database includes these molecules). Simply draw toluene as your template and the analysis will return all molecules that contain at least one toluene structure.
ChemBioDraw 13.0 Note: You can remove a structure name by clicking Clear. If you select Use Default , the name of the structure will be replaced by the default name i.e. Chemical Formula. 3. Type the name and click OK. Using the clipboard You can cut, copy, and paste structures using the clipboard. The Copy As command in ChemDraw/Excel 13.0 lets you copy a structure as InChI, InChIkey, or SMILES string. To cut a structure from a cell: 1. Select the structure. 2. Go to ChemOffice13>Molecule>Cut.
ChemBioDraw 13.0 Displaying structures You can display or hide structures in you spreadsheet. You can also adjust the size of cells to display their entire contents. To show or hide structures: 1. Select the structures. 2. Select ChemOffice13>Structure>Show or Hide. Aligning structures A structure may be too big for its cell or be improperly positioned. To align structures, select the cell that contains the structure and go to ChemOffice13>Structure>Align. The cells adjust to display their contents.
ChemBioDraw 13.0 Each property is calculated using the “best available” method. If the cell reference argument does not point to a valid structure cell, #N/A appears in the cell. All ChemDraw/Excel functions are described below. Chemical name Displays systematic names for chemical structures with support for the Cahn-Ingold-Prelog rules for stereochemistry.
ChemBioDraw 13.0 Molecular weight Displays the average molecular mass of the structure, where atomic masses are based on the weighted average of all isotope masses for the element. Units atomic mass units Functions CHEM_MOLWEIGHT(cell ref) CHEMPROPSTD_MOL_WEIGHT(cell ref) CHEMPROPSTD_MASS(cell ref) Examples In cell: =CHEM_MOLWEIGHT(A2) Result: 174.23896 In cell: =CHEMPROPSTD_MOL_WEIGHT(A2) Result: 174.238960 In cell: =CHEMPROPSTD_MASS(A2) Result: 174.
ChemBioDraw 13.0 Examples In cell: =CHEM_NUM_ATOMS(A2) Result: 27 In cell: =CHEM_NUM_ATOMS(A2, "C") Result: 12 Number of hydrogen-bond acceptors Displays the number of hydrogen-bond acceptors based on topology. Function CHEM_NUM_HBACCEPTORS(cell ref) Example In cell: =CHEM_NUM_HBACCEPTORS(A2) Result: 1 Number of hydrogen-bond donors Displays the number of hydrogen-bond donors based on topology.
ChemBioDraw 13.0 Does cell have a structure drawing? Returns TRUE if the cell has a ChemOffice/Excel structure drawing or reaction drawings, returns FALSE otherwise. Function ISSTRUCTURE(cell ref) Example In cell: =ISSTRUCTURE(A2) Result: False Does cell have reaction drawing? Returns TRUE if the cell contains a drawing of a reaction. Function ISREACTION(cell ref) Example In cell: =ISREACTION(A2 Result: True Boiling point The boiling point for the molecule at 1 atm.
ChemBioDraw 13.0 Vapor pressure The vapor pressure for the structure at 25° C. Units Pa Function CHEMPROPPRO_VAPOR_PRESSURE(cell ref) Example In cell: =CHEMPROPPRO_VAPOR_PRESSURE(A2) Result: 47.57999897 Critical pressure The minimum pressure that must be applied to liquefy the structure at the critical temperature. Units bar Function CHEMPROPPRO_CRITICAL_PRESSURE(cell ref) Example In cell: =CHEMPROPPRO_CRITICAL_PRESSURE(A2) Result: 49.
ChemBioDraw 13.0 Example In cell: =CHEMPROPPRO_CRITICAL_VOLUME(A2) Result: 562.5 Gibbs free energy The Gibbs free energy for the structure at 298.15 K and 1 atm. Units kJ/mole Function CHEMPROPPRO_GIBBS_FREE_ENERGY(cell ref) Example In cell: =CHEMPROPPRO_GIBBS_FREE_ENERGY(A2) Result: 84.77 Heat of formation The heat of formation for the structure at 298.15 K and 1 atm.
ChemBioDraw 13.0 Functions CHEMPROPPRO_LOGP(cell ref) CLOGP_DRIVER_PARTITION_COEFFICIENT(cell ref) Examples In cell: =CHEMPROPPRO_LOGP(A2) Result: 2.233 In cell: =CLOGP_DRIVER_PARTITION_COEFFICIENT(A2) Result: 2.243 Molar refractivity The molar refraction index. Units cm3/mole Functions CHEMPROPPRO_MOL_REFRACTIVITY(cell ref) CLOGP_DRIVER_MOL_REFRACTIVITY(cell ref) Examples In cell: =CHEMPROPPRO_MOL_REFRACTIVITY(A2) Result: 53.305 In cell: =CLOGP_DRIVER_MOL_REFRACTIVITY(A2) Result: 5.
ChemBioDraw 13.0 Function CHEMPROPSTD_CONNOLLY_ACCESSIBLE_AREA(cell ref) Example In cell: =CHEMPROPSTD_CONNOLLY_ACCESSIBLE_AREA(A2) Result: 428.557 Note: The default probe radius used in the calculations is 1.4 angstroms. Connolly molecular surface area The contact surface created when a spherical probe (representing the solvent) is rolled over the molecular model.
ChemBioDraw 13.0 Function CHEMPROPSTD_OVALITY(cell ref) Example In cell: =CHEMPROPSTD_OVALITY(A2) Result: 1.428947 Principal moments of Inertia (X, Y, Z) The moments of inertia when the Cartesian coordinate axes are the principal axes of the molecule. Units grams/mole angstroms2 Function CHEMPROPSTD_PRINCIPAL_MOMENT(cell ref) Example In cell: =CHEMPROPSTD_PRINCIPAL_MOMENT(A2) Result: 249.546 1409.279 1658.
ChemBioDraw 13.0 Number of rotatable bonds Function MOLECULAR_TOPOLOGY_NUM_ROTATABLE_BONDS(cell ref) Example In cell: =MOLECULAR_TOPOLOGY_NUM_ROTATABLE_BONDS(A2) Result: 2 Polar surface area Function MOLECULAR_TOPOLOGY_POLAR_SURFACE_AREA(cell ref) Example In cell: =MOLECULAR_TOPOLOGY_POLAR_SURFACE_AREA(A2) Result: 17.
ChemBioDraw 13.
ChemBioDraw 13.0 Wiener index Function MOLECULAR_TOPOLOGY_WIENER_INDEX(cell ref) Example In cell: =MOLECULAR_TOPOLOGY_WIENER_INDEX(A2) Result: 249 MOLECULAR_NETWORKS_LOGP The partition coefficient is a ratio of concentrations of un-ionized compound between two solutions. The logarithm of the ratio of the concentrations of the un-ionized solute in the solvents is called LogP. Function MOLECULAR_NETWORKS_LOGP(cell ref) Example In cell: =MOLECULAR_NETWORKS_LOGP(A4) Result: 3.
ChemBioDraw 13.0 1. TheLipinski rule of five. 2. The Ghose modifications 3. The Congreve Rule-of-Three. Lipinski rule of five The Lipinski rule uses five criteria to determine whether a substance is druglike. The substance must have: Five or fewer H-bond donors. Ten or fewer H-bond acceptors. A molecular weight under 500 daltons. LogP lower than 5. Fewer than two violations of the above four rules. To determine whether the substance meets the Lipinski rule requirement: 1.
ChemBioDraw 13.0 2. Verify that the value returned by the functions meets the Ghose modification criteria. For example, if the value returned by the function CHEMPROPPRO.LOGP() for that structure is within the range -0.4 to +5.6, it satisfies Ghose modification’s fourth criteria. 3. Calculate the number of criteria satisfied. If the number of violations is less than two, then the Ghose modifications requirement is satisfied.
ChemBioDraw 13.0 Property predictions in ChemDraw/Excel ChemDraw/Excel includes a variety of functions for reporting properties for a given structure. Each property is calculated using the “best available” method. To view the properties for a given structure: 1. Select the structure cell. 2. Right-click the cell and select Structure>Properties from the context-menu.The Properties dialog box displaying various properties and its values appears.
ChemBioDraw 13.0 Where: q is the number of edges in the molecular graph. m= (q-n+1) is the cyclomatic number of molecular graph. n is the number of atoms in the molecular graph. Si is the sum of all entries in the ith row (or column) of the topological distance matrix of the molecule. The distance matrix stores the shortest path between all pairs of atoms. Boiling point The boiling point is report in Kelvin. A solution boils at a slightly higher temperature than the pure solvent.
ChemBioDraw 13.0 Critical temperature Reported in Kelvin, this is the temperature above which a gas cannot be liquefied, regardless of the pressure applied. Critical volume Reported in cm3/mol, this is the volume occupied by one mole of a substance at the critical temperature and pressure. Exact mass This is the sum of the masses of the individual isotopes in the molecule. For example, the exact mass of water containing two hydrogen-1 (1H) and one oxygen-16 (16O) is 1.0078 + 1.0078 + 15.9994 = 18.0106.
ChemBioDraw 13.0 V is volume (SI unit: m3) T is the temperature (SI unit: Kelvin) S is the entropy (SI unit: joule per Kelvin) H is the enthalpy (SI unit: Joule) Note: H and S are thermodynamic values found at standard temperature and pressure.. Heat of formation Reported in KJ/mole, the heat of formation is the increase in enthalpy resulting from the formation of one mole of a substance from its constituent elements at constant pressure.
ChemBioDraw 13.0 Where ‘H’ is the enthalpy of the gas, calculated as: H = U + pV. MOLECULAR_NETWORKS_LOGP The partition coefficient is a ratio of concentrations of un-ionized compound between two solutions. To measure the partition coefficient of ionizable solutes, the pH of the aqueous phase is adjusted so that the predominant form of the compound is un-ionized. The logarithm of the ratio of the concentrations of the un-ionized solute in the solvents is called LogP.
ChemBioDraw 13.0 Where ‘NA’ is the Avogadro constant and a is the mean polarizability. Molecular formula This is the molecular formula of the compound. Molecular weight This is the sum of the atomic weights of all atoms in a molecule. Num rotatable bonds Is the number of rotatable bonds in a molecule. A rotatable bond is defined as an acyclic bond drawn as a single bond (amide C-N bonds, O=C--N, are rotatable) where the atom on each end has at least one other non-hydrogen substituent.
ChemBioDraw 13.0 Distances are established along each line proportional to the reciprocal of the square root of I on either side of the center of mass. The locus of these distances forms an ellipsoidal surface. The principal moments are associated with the principal axes of the ellipsoid. If all three moments are equal, the molecule is considered to be a symmetrical top. If no moments are equal, the molecule is considered to be an unsymmetrical top.
ChemBioDraw 13.0 Total connectivity Is the connectivity considered over all the heteroatoms. Total Valence Connectivity Is the valence connectivity considered over all the heteroatoms. Vapor pressure Is the pressure exerted by a vapor in equilibrium with its solid or liquid phase. Vapor pressure measures the concentration of solvent molecules in the gas phase. Vapor pressure can be calculated using Raoult’s law.
ChemBioDraw 13.0 Search Results- by default the search result appears in the same worksheet on which the search is performed. The "Display in a new worksheet" option creates a new worksheet with the name "SearchResults X" (where X is 1,2.3...) and displays the search result in this new worksheet, without changing anything in the original worksheet.
ChemBioDraw 13.0 You use the generic reaction to search your chemical database for compounds that match the reactant query structures. Once all the matching compounds are found, CombiChem generates a list of reactions from the compounds that were found in the query. The generic reaction you create must meet these criteria: All generic atoms in the reactant(s) must be represented by R-groups. Solvents, catalysts, and other “real-world” elements must not be included in the generic reaction.
ChemBioDraw 13.0 3. In ChemBioDraw, draw the generic reaction. 4. In ChemBioDraw, go to File>Exit. You will be returned to Excel and the reaction will appear in the worksheet. Tip: To display or hide the reaction, click the Show Picture or Hide Picture icon. Note: Do not add more than one reaction to a reaction template. Creating reactant worksheets The generic reaction contains at least one generic reactant (a reactant that has one or more R-group attachments).
ChemBioDraw 13.0 After launching, ChemBioFinder uses the form you entered to search its corresponding database for records that match the generic reactant. You can browse the search results in ChemBioFinder before importing them into the Excel reactant worksheet. Tip: To omit a record from the search results, navigate to the record in ChemBioFinder and go to Record>Omit from List in the ChemBioFinder main menu. 5. In Excel, go to ChemOffice13>CombiChem>Reactants>Import ChemBioFinder Hitlist.
ChemBioDraw 13.0 For example, you can take all the reactants you imported and enumerate an experiment containing all possible combinations of reactants. After calculating properties on these products, you might decide that 10% of these products are worth synthesizing in the lab. You could then create an experiment with just those products that the calculations show to be promising.
ChemBioDraw 13.0 Note: Whenever you create a new experiment, existing experiment worksheets are retained. If you want to delete them, right-click each experiment tab and select Delete or use the experiments floating form (Combi Options>Experiment>Delete). Go to Combi Options>Experiment>Toggle to hide/unhide all the experiment worksheets in the workbook. Configuring plates After you create an experiment, you can assign your products to product wells and your experiment reactants to reactant block plates.
ChemBioDraw 13.0 Three columns are added to the reactant or product worksheet: Well Plate, Well Row, and Well Column. To change specific plate assignments, edit the values on the worksheet. To remove all plate well assignments: 1. Select the worksheet where you want to remove assignments. 2. Go to ChemOffice13>CombiChem>Plates> Remove well assignments. Browsing plates After assigning reactants or products to wells, you can view which one has been assigned to each well. 1.
ChemBioDraw 13.0 2. Go to ChemOffice13>CombiChem>Highlight Related Records. The related records on the Experiment Reactant and Experiment Product sheet are displayed in color. 3. (Optional) To remove the highlighting from all rows, go to ChemOffice13>CombiChem>Highlight>Unhighlight All. Setting preferences Combichem provides several options for you to choose how and whether certain information appears on each worksheet.
ChemBioDraw 13.0 3. Click the Analysis tab. An analysis of the reaction steps appears below the reaction display and a new tab is added for each generic reactant in the reaction. 4. Click the tab for the a generic reactant. 5. Click the Browse button to select a ChemBioFinder or SDFile database, or other source of chemical structures such as a collection of ChemBioDraw 13.0 files. 6. Click Search.The search returns all structures in the database file that match the reactant.
ChemBioDraw 13.0 Query structures A query is simply a search for information that is stored in a database. If you have ever searched the Internet using a Web browser, then you have performed a simple query. A query structure is a parameter you use to search a chemical database (the database must include structures for the query to be useful). The query structure can include bond and atom properties that you specify to narrow or broaden the list of search results.
ChemBioDraw 13.0 You can use other generic labels to indicate other types of query criteria. The generic labels that Chem & Bio Office 13.0 supports are listed below (all are recognized as chemically significant). A: represents any non hydrogen. M: represents a metal. Q: represents an atom that is neither hydrogen nor carbon. X: represents any halide. R: unrestricted; represents one or more connected atoms of any kind.
ChemBioDraw 13.0 Note: For the Windows version, you need both the Reaxys Structure Editor plug-in and either the ChemDraw v11 or v12 plugin installed on your system. In addition to A, M, Q, X, and R, Reaxys recognizes several other generic atoms. To add a Reaxys generic label to a structure: Right-click an atom, point to Insert Generic Label on the context menu, point to Reaxys and click the label in the sub-menu you wish to insert. The table below lists the labels and their meaning.
ChemBioDraw 13.0 Labels Meaning CYC Cyclic CYH Cyclic or H CBC Carbocyclic CBH Carbocyclic or H ARY Aryl ARH Aryl or H CAL Cycloalkyl CAH Cycloalkyl or H CEL Cycloalkenyl CEH Cycloalkenyl or H CHC Heterocyclic CHH Heterocyclic or H HAR Hetero aryl HAH Hetero aryl or H CXX No carbon CXH No carbon or H Atom properties Atom properties determine what structural features are allowed at the site of an atom.
ChemBioDraw 13.0 Query indicators Query indicators display the atom properties that you assign to a structure, as shown below. If more than one property is assigned, an indicator for each property appears adjacent to the atom. Figure 11.2: This structure illustrates several possible atom properties that can be assigned.
ChemBioDraw 13.0 1. Select the structure. 2. Right-click and go to Atom> or Bond>Show Query Indicator on the context menu. Positioning query indicators You can position a query indicator by either dragging it or entering a numeric value for the new location. 1. Right-click the indicator and choose Position. The Position Indicator dialog box appears. 2.
ChemBioDraw 13.0 For example, in the figure below, the carbonyl carbon (B) has a substituents count of two, the alpha carbon (A) and the aldehyde oxygen. (hydrogen atoms are not counted). The aldehyde oxygen has only one substituent. The substituent count atom property lets you specify the number of bonds to an atom in the target structure. This includes bonds already drawn in the query structure. The substituent options are: Unspecified. This is the default. The target base determines the search.
ChemBioDraw 13.0 Query Finds Does not find Upto Exact Implicit hydrogens An implicit hydrogen is a hydrogen atom in which it or its bond is implied but is not visible. An explicit hydrogen and its bond are visible. Figure 11.3: A) examples of implicit hydrogens; B) an explicit hydrogen. The implicit hydrogens property specifies whether additional, implicit hydrogen atoms may be attached to the selected atoms.
ChemBioDraw 13.0 Any. Default. Finds compounds in which the selected atoms can be a member of any type of ring, or a member of no ring at all. No ring bonds. Finds compounds in which the selected atoms are acyclic. As drawn. Finds compounds in which the selected atoms reside in the same type and number of rings as drawn. Simple ring. Finds compounds in which the selected atoms is a member of only one ring (the atom has two ring bonds). Fusion.
ChemBioDraw 13.0 Figure 11.4: The reaction stereo indicator (circled). Any. Default. Finds all compounds regardless of the stereochemistry at the selected atoms. Inversion. Finds compounds in which the selected atoms have an inverted stereo configuration after a reaction. Retention. Finds compounds whose selected atoms have an unchanged stereo configuration after a reaction. Free sites Using free sites, you can specify the maximum number of substituents a result can have.
ChemBioDraw 13.0 Figure 11.2: 4-(cyclohexylidenemethyl)aniline Figure 11.3: (E)-3-(4-aminophenyl)-2-phenylacrylic acid To increase the number of free sites: 1. To display the query tools, go to View>Other Toolbars>Query Tools or click the Query Tools icon on the Main Tool palette. 2. Click the Free Site tool on the Query tools palette. 3. Click the atom to which you want to apply free sites. 4. Continue to click the atom to increase the free site number.
ChemBioDraw 13.0 Narrow. Translates query superatoms to corresponding specific atoms or groups in the database. Any. Translates generic or specific terms to any term. For more information, see the Markush DARC User Manual. Isotopic abundance The Isotopic Abundance property lets you distinguish different isotopic compounds—for example between mono- and hexa-deuterobenzene—by specifying a nuclide at any location. Note: The isotopic abundance property is available in ChemBioDraw Ultra 13.
ChemBioDraw 13.0 Go to Structure>Bond Properties. On the Bond Properties tab, select the desired properties from the dropdown lists and click OK. Point to bond and press the hotkey “/ ”. The Bond Properties dialog box appears. 3. In the Bond Properties dialog box, select the properties to associate with the selected atoms. Click OK. For more information, see "Query indicators" on page 201.
ChemBioDraw 13.0 1. Select the bonds. 2. Go to Structure>Bond Properties. 3. Click Use Defaults. To remove specific bond properties: 1. Select the bond. 2. Do one of the following: Right-click, point to the appropriate property, and click the property to remove. Go to Structure>Bond Properties and click the bond property to remove. Bond property options The properties you can assign to bonds are described below. Bond types This property specifies the bond type of the selected bonds.
ChemBioDraw 13.0 Reaction center The Reaction Center property specifies how the selected bonds are affected in a reaction. This property is meaningful only when searching a database containing chemical reactions. Unspecified. Default. Finds compounds regardless of whether the selected bonds are affected by the reaction. Center. Finds compounds where the selected bonds are affected by a reaction, but the type of change is unspecified. Make/Break.
ChemBioDraw 13.0 (A) indicates that the atom must match any atom except hydrogen. The indicator (B) near the bond indicates that the bond must be single or double, S/D. The element list (C) specifies that one of these elements must match in the target structures. Element not-lists The element not-list specifies that the elements in the list are not allowed in the search results. Commas must separate the elements in the element not-list. A space after each comma and brackets are optional.
ChemBioDraw 13.0 To enclose structures with brackets: 1. To display the Bracket toolbar, go to View>Other Toolbars>Bracket. 2. On the Bracket toolbar, select one of the double bracket tools. 3. To draw the brackets, click and drag across the structure to enclose. This gives default value for component order, multiple group repeat count, or single repeating unit label. Setting bracket properties To set the Bracket Properties: 1. Select a bracket. 2. Go to Structure>Bracket Properties.
ChemBioDraw 13.0 You can also use the bracket usage types “Crosslink (xl)”, “Graft (grf)”, and “Modification (mod)” to represent types of repeating units in a structure-based representation. Source-based polymers Source-based polymer representations enclose a discrete chemical substance in brackets. The mode of polymerization may be obvious from context or be unknown.
ChemBioDraw 13.0 Figure 11.6: Brackets used to indicate mixtures Bracket type “Mixture, ordered (f)” is primarily used to describe manufacturing processes, where component order is critical. As with unordered mixtures, individual elements of an ordered mixture should be surrounded by brackets with a bracket usage of “Component (c)”. However, components of ordered mixtures must be numbered to show their order.
ChemBioDraw 13.0 Repeat pattern For simple linear polymers, the repeating units may connect head-to-tail or head-to-head (or their repeat pattern might be a mixture or unknown). You can also assign this property to brackets. The head-to-tail type is the default repeat pattern. Figure 11.8: Head-to-tail repeat pattern. A and B represent the polymers shown. C represents a mixture of A and B.
ChemBioDraw 13.0 1. Open an atom label text box. 2. Type the link node in this format: [CH2]3-7 Flip type For ladder polymers (polymers with two connecting bonds on each side) the connection order may be undefined. You can assign the Flip Type property to define it. This property is only for brackets with exactly two crossing bonds. Because of its prevalence, the No Flip type does not receive special annotation. The figure below illustrates a flip type in ladder polymers.
ChemBioDraw 13.0 Defining alternative groups You can create alternative group definitions (R, G, etc.) that represent a set of substituents, each of which is used in the query. To define alternative groups: 1. Go to View>Other Toolbars>Query Tools to open the Query toolbar. 2. Click the Alternative Group query tool and drag with the tool to create an area large enough to draw the alternative groups. 3.
ChemBioDraw 13.0 Figure 11.9: Defining an alternative group Specify where the fragments should bond to the parent structure on the alternative group label by defining attachment Points. 1. Do one of the following: Select the diamond shaped Attachment Point tool on the Chemical Symbols palette (View>Other Toolbars>Chemical Symbols), and click a substructure fragment where you want to place the attachment point.
ChemBioDraw 13.0 Multiple attachment points You can use R-groups that contain more than one attachment point, such as: For this type of R-group, you must indicate in your table the attachment point order. If you have well-defined multiple attachment points on your structure fragments, you can search for specific materials. This type of search is useful for finding conformationally similar structures. For example, assume you want to find compounds in figure A below but not compounds in figure B.
ChemBioDraw 13.0 3. Draw the structure fragments and label them with attachment points. When the alternative group definition is complete, the attachment point symbols appear in the parent compound. Figure 11.13: R-groups with multi-attachment points By numbering your attachment points, you specify that the methyl group must be adjacent to the amine group. The conformations that are not of interest are excluded.
ChemBioDraw 13.0 The figure below shows an alternative group definition and a parent structure with the attachment rank indicators hidden. Figure 11.14: Hidden attachment indicators R-group reaction queries You can search and store reactions. In a reaction, one or several compounds (reactants) are transformed into other compounds (products). Individual reactants (or products) are separated from each other with plus signs. The reactants are separated from the products with an arrow.
ChemBioDraw 13.0 Figure 11.15: Sample r-group reactant query A likely hit for the above query is shown below: Searching for products If you know the desired end product but not how to get there, you can do a products query. A products query is similar to a reaction search, except that there is nothing to the left of the arrow. For example, consider the query: Figure 11.
ChemBioDraw 13.0 2. Type an open bracket “[”followed by a list of elements, fragments, nicknames, or generic nicknames separated by commas, followed by a close bracket “]”. Expand generic structures You can generate multiple structures from an abbreviated combinatorial structure with the Expand Generic Structure tool. The tool is limited to 500 generated structures. For large combinatorial expansions, use CombiChem for Excel.
ChemBioDraw 13.0 definition example Definitions are expanded into multiple complete molecules. If more than one site is present in the selection, the expansion includes all permutations of substitutions. Expansions are generated in a new document. To expand a generic structure: 1. Select one or more generic structures to expand. Note: For alternative group/R-tables, you must select the alternative group label and the table must be selected.
ChemBioDraw 13.0 This structure indicates that both R sites must consist of either a fluorine or chlorine atom and that the R site must 1 2 be either a bromine or iodine atom. Assume you want to find all structures in your database that have either a F or Cl atom at both R locations and either 1 Br or I at R : 2 1. Go to Structure>R-Logic Query. 2. In the R-Group dropdown list, select R . 1 3. For Occurrence range, select 2.
ChemBioDraw 13.0 When a reaction map is established, you can point to an atom in one structure with the Reaction Atom-Atom Map tool to highlight the mapped atom in the other structure. Displaying and printing To display reaction mapping symbols on screen and in print: 1. Go to File>Preferences. 2. In the Preferences dialog box, click the Building/Display tab. 3. Select Always Display and Print Reaction Mapping. 4. Click OK.
ChemBioDraw 13.0 you can manually readjust the reaction mapping. The figure below shows the initial mapping being amended by using the Reaction Atom-Atom Map tool. Figure 11.19: Automatic mapping to be amended When you manually map reactions with the Reaction Atom-Atom Map tool, you can suppress automatic re-mapping of atoms other than your target atom. To suppress automatic remapping: 1. Go to File>Preferences. 2. On the General tab, de-select Automatic Reaction Mapping. 3. Click OK.
ChemBioDraw 13.0 Figure 11.20: Finalized mapping You can set or change the mapping for other atoms in the reaction. Clearing reaction mapping To clear reaction mapping: 1. Select the structures whose mapping you want to clear. 2. Go to Structure>Clear Reaction Map. Clicking and dragging from any atom to an empty space in the ChemDraw window using the Reaction Atom-Atom Map tool will clear the mapping from that atom.
ChemBioDraw 13.0 1. To display the Query tools, go to View>Other Toolbars>Query Tools or click the Query Tools icon on the Main Tool palette. 2. On the Query tools palette, click the tool for the flag you want to use. 3. Click next to the structure to which you want to assign the flag. 3D properties 3D queries are useful in pharmacophore searching when looking for a 3D relationship among atoms and bonds, (for example in a series of potential receptor ligands).
ChemBioDraw 13.0 Geometry and constraint objects update when you change the structure; they cannot be moved independently. They may be used with CDX, MOL, SKC, and TGF files (full read-write compatibility); they are not compatible with other formats. They can, however, be saved in print-only formats such as TIFF. Export compatibility Because query properties are useful only in a chemical database, you must transfer your structures from ChemBioDraw 13.0 into your search system.
ChemBioDraw 13.
ChemBioDraw 13.
ChemBioDraw 13.
ChemBioDraw 13.0 Sharing information Many of the system commands you commonly use to transfer content from one place to another can also be used in ChemBioDraw: copy/paste import and export content files When you use the clipboard, the object you are copying can be edited. The clipboard You can use the clipboard to transfer part or all information within an active document window between applications on the same computer or on a network.
ChemBioDraw 13.0 SMILES supports an alternate notation for aromatic structures using lowercase letters. ChemBioDraw 13.0 generates this type of SMILES string for any structure drawn with explicit aromatic bonds. Pasting SMILES To paste a SMILES string as a structure: 1. Select the SMILES string in the source file and press CTRL+C. 2. In ChemBioDraw 13.0, go to Edit>Paste Special> SMILES. Creating SLN strings You can copy a structure to the Clipboard as an SLN string for export to other applications.
ChemBioDraw 13.0 standard makes InChIKey strings useful for Web searching and database indexing. To copy a structure as an InChIKey string to other documents: 1. Select the structure. 2. Go to Edit>Copy As>InChIKey. For more information on InChI™ and InChIKey, see www.iupac.org/inchi/. Scrap and clipping Files You can use scrap files to copy parts of a drawing to other applications after saving the file in ChemBioDraw 13.0. To create a scrap or clipping file: 1. Select an object in a document. 2.
ChemBioDraw 13.0 Except for the foreground and background color, the colors present in the selection to be pasted are added to the destination document’s Color palette if they are not already (up to 20 total colors). The background color in the destination document remains, and all objects colored using the foreground color are changed to match the foreground color in the destination document. Pasting to an Empty Document. If you paste a ChemBioDraw 13.
ChemBioDraw 13.0 b. Select a file format. c. Click OK. Some file formats do not support atom labels that contain nicknames or structural fragments. When you save in these formats, ChemBioDraw 13.0 expands all atom labels and saves the file using the expanded form. These formats do not support nicknames or structural fragments: Connection Table MSI MolFile SMD Note: Some versions of ChemBioDraw 13.0 do not support all the formats listed. Some formats can be saved with different options.
ChemBioDraw 13.0 2. In the Insert Object dialog box, click Create from File. 3. Browse to the object file and click OK. Note: If you choose a file type that ChemBioDraw 13.0 does not support (such as TXT) you will get an error message. To create an object: 1. Go to Edit>Insert Object. 2. Click Create New. 3. Select the Object Type. 4. Click OK. ISIS™ compatibility ChemBioDraw Ultra 13.0, and ChemDraw Pro 13.0 support ISIS/Sketch including R-Logic and leaving groups.
ChemBioDraw 13.0 Graphics export border preference You can specify the border size when exporting pictures. This preference affects the output of all graphical formats, such as: WMF, PICT, EPS, TIFF, GIF, BMP, and PNG. It applies to the clipboard and saved files. The default value is 2 points (0.278 in; 0.071 cm). File formats The file formats available in ChemBioDraw 13.
ChemBioDraw 13.0 Format Windows EnhancedMetafile (EMF) YES ChemDraw Templates CTP) YES ChemDraw Templates Style sheets (CTS) YES PDF NO MDL Molfile V3000 YES Reaction Molfile V3000 (RXN) YES PICT PICT Scaled 4x NO Encapsulated PostScript YES Scalable Vector Graphics YES ChemBioDraw 13.0 supports importing and exporting the file formats listed below. To export in one of these formats, use the Save As... option. Not all formats are supported in all ChemBioDraw 13.0 products.
ChemBioDraw 13.
ChemBioDraw 13.0 Preferences and settings You can customize ChemBioDraw 13.0 by configuring Preferences and Document Settings for the way you work. Preferences allow you to change the default behavior of certain options that apply to every open document. The changes you specify in the document settings are applicable only within the document and is not applicable throughout the application. The changes you specify in the object settings are specific to the selected object.
ChemBioDraw 13.0 To activate the I/Draw mode, go to File>Preferences and click I/Draw Mode. Default document location You can set the default file directory for each time you open a file. 1. Go to File>Preferences. The Preferences dialog box appears. 2. Click the Directories tab. 3. Click the Use Documents Location checkbox and type in or browse to the location to use. Default open file format To set the default file format in the Open dialog box: 1. Go to File>Preferences.
ChemBioDraw 13.0 The ChemDraw items folder The folder contains the preferences, hotkeys, nicknames, and isotopes files; scripts, and the generic nicknames file. It also contains template documents and template Stationery Pads. You can have multiple ChemDraw Items folders. This is useful in corporate installations for maintaining personal files such as nicknames and standard templates. The location of the ChemDraw Items folder is based on your operating system.
ChemBioDraw 13.0 To save a document’s setting as a style sheet: 1. Go to File>Save As. The Save As dialog box appears. 2. Name the file and change the type (in OS X: format) to CD Style Sheet (cds) 3. To save the file in the ChemDraw items folder, click Go To ChemDraw Items. 4. Click Save. Setting preferences Preferences affect how ChemBioDraw 13.0 works, regardless of the document with which you are working. 1. To open the Preferences dialog box, go to File>Preferences. 2.
ChemBioDraw 13.0 Default document location You can set the default file directory for each time you open a file. 1. Go to File>Preferences. The Preferences dialog box appears. 2. Click the Directories tab. 3. Click the Use Documents Location checkbox and type in or browse to the location to use. Default open file format To set the default file format in the Open dialog box: 1. Go to File>Preferences. The Preferences dialog box appears. 2. Click the Open/Save tab. 3.
ChemBioDraw 13.0 The ChemDraw items folder The folder contains the preferences, hotkeys, nicknames, and isotopes files; scripts, and the generic nicknames file. It also contains template documents and template Stationery Pads. You can have multiple ChemDraw Items folders. This is useful in corporate installations for maintaining personal files such as nicknames and standard templates. The location of the ChemDraw Items folder is based on your operating system.
ChemBioDraw 13.0 To save a document’s setting as a style sheet: 1. Go to File>Save As. The Save As dialog box appears. 2. Name the file and change the type (in OS X: format) to CD Style Sheet (cds) 3. To save the file in the ChemDraw items folder, click Go To ChemDraw Items. 4. Click Save. Customizing toolbars The look and arrangement of toolbars are defined by a set of XML files. If you are familiar with editing XML files, your can modify the toolbar for the way you work.
ChemBioDraw 13.0 Apply settings to the entire current document from an existing document. Apply settings to selected objects in the current document from an existing document. Drawing settings Drawing settings affect how bonds and other objects are drawn. You can configure the drawing settings for an entire document or for a particular object as follows: For the entire document, go to File>Document Settings and select the Drawingcategory. For an object, use the Object Settings dialog box.
ChemBioDraw 13.0 An absolute value you choose in the units specified for your document. Bold Width. Set the width of the line used when bold and wedge bonds are drawn. The Bold Width setting must be greater than the Line Width setting. The end of a wedge is 1.5 times the bold width. Line Width. Set the width of all bonds, lines, and arrowheads in the drawing. Margin Width. Change the amount of space surrounding all atom labels that will erase portions of the bonds to which they are attached.
ChemBioDraw 13.0 Configuring objects To configure the drawing settings for a selected object: 1. Select the object. 2. Go to Object>Object Settings. 3. Configure the settings and click OK. The settings you chose are applied only to the selected object. Analysis and properties You can paste fundamental structure properties into your drawing. You can also rename these properties when desired. For instance, you may consider renaming “Molecular Weight” to “MW” to save room on the page.
ChemBioDraw 13.0 6. Repeat step 4 for other properties, as desired. 7. Click OK. Formatting captions Text settings affect how captions and atom labels for the current document are drawn and formatted. Formatting options include: font (font type) size (font size) style (font and baseline style) line spacing alignment Setting font parameters Changing text formats in the Document Settings dialog box affects the current document only.
ChemBioDraw 13.0 Style indicators Select any text in the document window and go to Text>Style to view the styles that have been applied. A check indicates the style applies to all the selected text. A hyphen indicates the style applies to some of the selected text. Specifying line spacing You can specify these types of line spacing: Automatic. Consistently spaced lines of text based on the height of the tallest character in the caption. This is the default line spacing. Variable.
ChemBioDraw 13.0 Figure 13.1: Atom label justification. A) stacked above; B) centered; C) flush left; D) flush right. Automatic alignment When you justify atom labels automatically, ChemBioDraw 13.0 breaks the label into tokens. A token consists of an uppercase letter followed by any numbers or lowercase letters. The first token is attached to the atom and the rest of the label appears without obscuring other parts of the chemical structure.
ChemBioDraw 13.0 If you label C1, the second and third tokens are placed above the first token since there are bonds below the atom. If you label C4, the second and third tokens are placed below the first token. Changing the default format Each new caption or atom label uses default document settings for the font, font-size, and style of captions and atom labels. You can change the format by: Changing the document settings for subsequent drawings in the current document.
ChemBioDraw 13.0 The format is applied to the typed text. Subsequent text you type uses the default document settings. Changing text spacing You can change the text settings for a selected caption or atom label. You can choose to have the settings applied to the selected text and to all subsequent text you type. To change the text settings for a selected caption or atom label: 1. Select the text to change with a selection tool. 2. Set the appropriate options on the Text menu.
ChemBioDraw 13.0 1. Go to File>Document Settings. The Document Settings dialog box appears. 2. Click the Drawing tab. 3. Type a new Margin Width value. 4. Click OK. The margin width is applied to all subsequent drawings in the current document. Settings from other documents To apply document settings to the active window that are contained in a different document, go to File>Apply Document Settings from and choose the document from which to apply the settings.
ChemBioDraw 13.0 "DNA": Hotkeys that sets the label for the DNA sequence. "RNA": Hotkeys that sets the label for the RNA sequence. “Generic”: Hotkeys that select tools and open dialog boxes Each Hotkey is encoded in this format: PAGE 279ChemBioDraw 13.0 PEN CYCLOBUTANE HASHEDBOND CYCLOPROPANE ARROW TEMPLATE HASHEDWEDGEDBOND SNAKINGCHAIN ORBITAL ACYCLICCHAIN BOLDBOND QUERY DRAWINGELEMENTS TABLE WEDGEDBOND ARC BRACKET WAVYBOND HOLLOWWEDGEDBOND CHEMICALSYMBOLS Note: The features that are available depends on the level of ChemBioDraw 13.0 you have. description The tool description explains what each hotkey does. Editing the hotkeys.xml file To edit ChemBioDraw hotkeys: 1. Open the hotkeys.xml file in a text editor. 2.
ChemBioDraw 13.0 1. Go to File>Document Settings and select the Colors tab. 2. Select the background and foreground colors. 3. Click OK. Color by element You can now color atom labels using colors associated with their atomic symbols.You can assign colors to elements in the periodic table. Whenever you use a particular element in your drawing, the element appears in same color you assigned to it in the periodic table. To assign different colors to elements in a periodic table: 1.
ChemBioDraw 13.0 The color palette Use the color palette to specify the color of objects and text in the document in the active window. A palette is stored in every document and style sheet.You can use style sheets to create a series of documents with the same color scheme. Customizing colors Changes you make to the color palette affect the current document only. You can save up to 20 colors. For more information, see "Document and object settings" on page 259.
ChemBioDraw 13.0 9. Click Add to Custom Colors. 10.Click OK. Templates and color The background and foreground colors in a template from the template pop-up palette are not used when the template is drawn in a document window. However, other colors in the template are added to the color palette of the document if they are not already present. For more information, see "Autoscaling" on page 237. Saving color palette settings You can save the color palette in a style sheet.
ChemBioDraw 13.0 Line Width: 0.6 pt Margin Width: 1.6 pt Hash Spacing: 2.5 pt Chain Angle (degrees): 120 Bond Spacing (% of length): 18 Atom Label Font : Atom Label Size: 10 pt Caption Font : Caption Size: 10 pt Drawing Area (Width x Height): 540 pt x 720 pt Page Size: US Letter Reduction (%): 100 Adv. Synth Catal. Fixed Length: 17 pt Bold Width: 2 pt Line Width: 1 pt Margin Width: 1.6 pt Hash Spacing: 2.
ChemBioDraw 13.0 Caption Font : Caption Size: 12 pt Drawing Area (Width x Height): 693 pt x 918 pt Page Size: US Letter Reduction (%): 80 J. Mol. Mod. (1 column) Fixed Length: 14.4 pt Bold Width: 2 pt Line Width: 0.6 pt Margin Width: 1.6 pt Hash Spacing: 2.5 pt Chain Angle (degrees): 120 Bond Spacing (% of length): 18 Atom Label Font: Times New Roman Atom Label Size: 10 pt Caption Font: Times New Roman Caption Size: 10 pt Drawing Area (Width x Height): 8.5 cm x 25.4 cm (1 column); 17 cm x 25.
ChemBioDraw 13.0 Bold Width: 4 pt Line Width: 1.6 pt Margin Width: 2 pt Hash Spacing: 2.7 pt Chain Angle (degrees): 120 Bond Spacing (% of length): 15 Atom Label Font : Atom Label Size: 12 pt Caption Font : Caption Size: 16 pt Drawing Area (Width x Height): 7.5 in x 10 in Page Size: US Letter Reduction (%): 100 Phytomedicine Fixed Length: 20 pt Bold Width: 1.33 pt Line Width: 1pt Margin Width: 1.
ChemBioDraw 13.0 Atom Label Size: 9 pt Caption Font : Caption Size: 9 pt Drawing Area (Width x Height): 8.9 cm x 25.4 cm (1 column); 19 cm x 27.7 cm Page Size: US Letter Reduction (%): 100 Science of Synthesis Fixed Length: 17 pt Bold Width: 2 pt Line Width: 0.8 pt Margin Width: 2.25 pt Hash Spacing: 2.5 pt Chain Angle (degrees): 120 Bond Spacing (% of length): 18 Atom Label Font : Atom Label Size: 10 pt Caption Font : Caption Size: 10 pt Drawing Area (Width x Height): 19.79 cm x 27.
ChemBioDraw 13.0 Verlag Helvetica Chimica Acta Fixed Length: 17 pt Bold Width: 2.9 pt Line Width: 0.54 pt Margin Width: 2 pt Hash Spacing: 2 pt Chain Angle (degrees): 120 Bond Spacing (% of length):14 Atom Label Font : Atom Label Size: 10 pt Caption Font : Caption Size: 12 pt Drawing Area (Width x Height): 368 x 720 pts Page Size: US Letter Reduction (%): 100 Wiley Document Fixed Length: 17 pt Bold Width:2.6 pt Line Width:0.75 pt Margin Width: 2 pt Hash Spacing: 2.
ChemBioDraw 13.0 Page layout Object alignment, page size, orientation, and other factors affect the presentation quality of your document. The drawing area The document window may not be the same size as the drawing area of the page. A document window, may cover only a part of the drawing area. These options let you set the drawing area on your screen. Document Settings and Page Setup let you modify the page, margins, headers, footers, document type, and size.
ChemBioDraw 13.0 4. Select whether to Print Registration Marks. 5. Create Headers and Footers. 6. Click OK. Headers and footers For posters, only one header and footer appear for the entire document. To create a header and footer: 1. Go to File>Document Settings. 2. Click Header/Footer category. 3. Enter the position from the edge of the page for the header or footer to appear. 4. Type the text to appear in the header or footer. 5.
ChemBioDraw 13.0 Figure 14.2: A) The filename is displayed center aligned in the header; B)The page number is displayed aligned right in the footer. Page setup To setup the page, go to File>Page Setup. Options appear below: Paper. Choose the size of the paper on which to print the document and the printer tray. Orientation. Select either Portrait or Landscape. Margins. By default, margins are set to 0.5 inches. Printer. Click to select a printer and set preferences.
ChemBioDraw 13.0 1. Select the document to print. 2. Go to File>Print. ChemBioDraw 13.0 opens and the Print dialog box appears. 3. Make your selections in the Print dialog box and click OK. Print options Select Printer. This window lists all printers connected to your computer. You can use the default printer or select another printer. Print to File. The document is saved as a .prn file and includes your printer preferences. The document can then be sent later to a printer. Find Printer.
ChemBioDraw 13.0 Two 35mm Slide Boundary Guides appear in the orientation chosen in the Page Setup dialog box. These guides appear in every document. Viewing drawings Magnification Magnification changes how large or small your drawing appears without changing its dimensions. You can either select a value in the magnification dropdown list or enter your own value between 1% and 999%. Magnify 1. Select an object to keep in view as you magnify the drawing.
ChemBioDraw 13.0 Figure 14.1: How rulers indicate position. A) The cursor; B) Ruler guides indicating vertical and horizontal location of the cursor. When you select an object, two guides appear in each ruler. The four guides together show the height and width of the selected object. Note: The rulers adopt the same units that were selected for the document settings. The crosshairs The crosshairs are helpful for positioning objects. To toggle the crosshairs on and off, go to View>Show Crosshair.
ChemBioDraw 13.0 Click and drag in the document window to create the table. The table has two rows and two columns. Click in the document window. Type the numbers of rows and columns in the Insert Table dialog box, and click OK. The table appears in the document window. Resizing tables To resize rows or columns, click and drag a border using the table tool. Note: To proportionally resize all rows and columns in the table, click and drag the top and left border of the table.
ChemBioDraw 13.0 To add or delete rows or columns in the table: 1. Point to the top or left border where you want to add or delete the row or column. A border appears as shown below. 2. Right-click the border and select the appropriate option from the context menu. To align all of the objects in a column or row, point to a top or left border using the Table tool, right-click, point to the Align command on the context menu, and choose the alignment you want.
ChemBioDraw 13.0 1. Select the caption. 2. Move the caption with the arrow keys. For more information on moving objects,see "Moving objects" on page 42. 3. To create another column with this same spacing as the previous, select the Text tool and press TAB. A third caption text box appears. Creating a new row To start a new row that is aligned with the first, press TAB twice at the end of a row.
ChemBioDraw 13.0 Chemical interpretation ChemBioDraw 13.0 converts lines, characters, and other symbols into chemically meaningful figures as you work. This occurs in the background, but you can also choose to view this chemical data. ChemBioDraw 13.0 uses the data when exporting to file formats that support only a subset of the notations that ChemBioDraw 13.0 does. This section describes how ChemBioDraw 13.0 interprets drawings.
ChemBioDraw 13.0 A successful search in one database might not produce results in another. When in doubt, consult the documentation for the conventions your database uses. Bond conventions The following table describes the chemical conventions ChemBioDraw 13.0 recognizes. Bond Description Single bond, unspecified stereo-chemistry. Single bond, “down” stereochemistry (into the plane of the paper, away from the viewer), from the first drawn atom to the second drawn atom.
ChemBioDraw 13.0 A single bond near a closed circle is recognized as aromatic: Atom labels A simple atom label may contain any of the following: A single element. An element and some number of hydrogen atoms. A nickname. Repeating units within parentheses. A series of any combination of the above. ChemBioDraw 13.0 analyzes atom labels from left to right, applying standard valence rules to determine which atoms are bonded together.
ChemBioDraw 13.0 atom label. Multi-attached atom labels are always parsed from beginning to end, but the beginning might be on the right if the atom label was in Automatic style and on the left side of the original structure: A multi-attached label that is parsed from left to right. A multi-attached label that is parsed from right to left. A bond attached to the open parenthesis of a repeating group is treated as if bonded to the first of those groups.
ChemBioDraw 13.0 Chemically significant text Often, it is simpler to write a chemical formula like MeOH or H2O than to draw an atoms-and-bonds structure. ChemBioDraw 13.0 interprets any unambiguous structural formula. For example, CH3COCH2CH3 is recognized as methyl ethyl ketone and MeOH is recognized as methanol. On the other hand, C6H6 might mean benzene, or another isomer. Generally, empirical formulas (C2H6 and H2SO4) are not recognized, but structural formulas (CH3CH3 and HOSO2OH) are.
ChemBioDraw 13.0 Charges that follow other repeating units are distributed among those units. Charges may be superscripted. Multiple charges are recognized appropriately. Charges may have repeat counts as long as both the charge and the repeat count are superscripted. A “floating” charge placed with the Chemical Symbols Tool is assigned to the nearest atom. If no atom is within the distance set as the Fixed Length, the charge is ignored and not assigned to any atom.
ChemBioDraw 13.0 Isotopes can be included anywhere that regular elements can. Deuterium and Tritium appear as one-letter symbols. Radicals Radicals are indicated with the appropriate symbol from the Chemical Symbols palette. As with charges, they are assigned to the nearest atom. Radicals always occupy one free valence, in addition to any charge effects. Two examples are: Note: The lone pair symbol is interpreted as a diradical when it is placed next to an unlabeled carbon atom.
ChemBioDraw 13.0 Multi-center attachments Multi-center attachments are meaningful only when created using Structure>Add Multi-Center Attachment. Multicenter attachments create a pseudo-atom that is disregarded during chemical calculations but still lets you create diagrams that look meaningful to an experienced chemist.
ChemBioDraw 13.0 Cahn-Ingold-Prelog Absolute stereochemistry is calculated for tetrahedral atoms and double bonds according to the Cahn-Ingold-Prelog (CIP) priority rules. The CIP rules are designed to order ligands by their priority and determine a descriptor based on the orientation of the ordered ligands in space. A ligand is an entity attached to a stereocenter. For example, a tetrahedral carbon has four ligands corresponding to its four substituents.
ChemBioDraw 13.0 Figure 15.2: The Absolute flag indicates the exact stereoisomer as drawn. Figure 15.3: The relative flag indicates the exact stereoisomer as drawn, or its enantiomer.
ChemBioDraw 13.0 Figure 15.4: The racemic flag indicates a mixture of the exact stereoisomer as drawn and its enantiomer. Polymer representations Polymers are represented by brackets used to enclose repeated structures or structural fragments. Bracket properties specify the orientation and context of the repeating units. For an explanation of the bracket properties, see "Setting bracket properties" on page 213. Note: The polymer drawing feature is available only in ChemBioDraw Ultra 13.
ChemBioDraw 13.0 Message Description Filled valences include sum of bond orders, charge, radicals, and free sites. Aromatic bonds count 1.5 each, rounded down unless it is the only bond to the atom. Charge is signed and includes charge implied by dative bonds. The Substituents query property treats free sites, up to and exactly the same way: an atom with two explicit bonds and “Substituents: Up To 3” or “Substituents: Exactly 3” or “Substituents: Free Sites 1” has three filled valences.
ChemBioDraw 13.0 Message Description Part of a molecule is outside of the Displayed for any Alternative Group Box whose border crosses part of a alternative group definition. structure. This is a status message only. This isolated bond is probably not Displayed for unlabeled single bonds unattached to other bonds. All bonds intended to have chemical sig- are interpreted chemically, usually as C2H6, and may cause unexpected nificance. results if intended as a graphical line only.
ChemBioDraw 13.0 Property calculations You can calculate predicted values of selected physical and thermodynamic properties for structures of up to 200 heavy atoms. This section describes how the values are determined. LogP Three fragmentation methods are used to predict the logP values. Method one is based on 94 atomic contributions evaluated from 830 molecules by least squares analysis. This method works with a standard deviation of 0.
ChemBioDraw 13.0 pKa, CLogP, and CMR Specific algorithms for calculating LogP and molar refractivity from fragment-based methods developed by the Medicinal Chemistry Project and BioByte. For more information, see http://www.biobyte.com/blqsar/index.html. LogP and CLogP estimate the Octanol/Water Partition Coefficient, but use different methods. CLogP and CMR are calculated as part of the Chemical Properties window.
ChemBioDraw 13.0 CLogP (CLogP driver Partition Coefficient) MR (ChemPropPro Mol Refractivity) CMR (CLogP driver Mol Refractivity). The ChemBio3D MOPAC interface Calculates the pKa of the most acidic hydrogen atom attached to an oxygen. For more information, see http://www.openmopac.net/pKa_table.html. For more information, "ChemDraw/Excel functions" on page 165, "LogP" on page 301, "Property calculations" on page 301, and "pKa, CLogP, and CMR" on page 302.
ChemBioDraw 13.0 Shortcuts and hotkeys Hotkeys are organized into atom labels, bond types, and functions (such as adding a charge or displaying a bond. Shortcuts are organized by the menu on which the command is found). Note: You can modify hotkeys and nicknames. The tables in this section refer to the default values. Atom keys Use atom keys to insert atoms in a drawing using your keyboard. For example, place your mouse over an atom and press ‘3’ to add a tert-butyl group.
ChemBioDraw 13.0 Atom Label Key C c Na N X x Cl C or l O o COOCH3 E D d OTs T CH2OH 6 Et e P p B B Bond hotkeys To modify a bond, place your mouse over the bond and select a key listed below.
ChemBioDraw 13.0 Function Key Position a double bond to the right r Change to wedged bond w Bring bond to front f Change to hashed bond H Open a bond properties text box / (slash) or ? Change to hashed-wedged bond h Fuse 5 membered ring 5 Fuse 6 membered ring 6 Fuse 7 membered ring 7 Fuse 8 membered ring 8 create chair form of cyclohexane with two different orien- 9 or 0 tations. Function hotkeys Function Key Add an attachment point .
ChemBioDraw 13.0 Function Key Open an atom label text box. Remove an atom label. , or Shortcuts Below is a list of key combinations for common tasks. File Command Key Combination Create a new doc- CTRL+N ument Open a document CTRL+O Save a document CTRL+S Save a document as...
ChemBioDraw 13.
ChemBioDraw 13.0 Command Key Combination Rotate... (opens Rotate Objects CTRL+R dialog box) Scale...
ChemBioDraw 13.
ChemBioDraw 13.
ChemBioDraw 13.0 The PerkinElmer Informatics web site The PerkinElmer Informatics Web site is a valuable source of helpful information. There you can: Register your software. Search for chemical information by name or ACX number; or, insert a structure into a worksheet. Get technical support, documentation, software downloads, and more. You can navigate to the site directly from ChemBioDraw by selecting the appropriate option in the Online menu.
ChemBioDraw 13.0 1. In ChemBioDraw 13.0, select a structure you have drawn. 2. Go to Online>Find Suppliers on ChemACX.com. The ChemACX.Com page opens with information on the selected structure. For more information on using the ChemACX Web site, see the ChemOffice Enterprise Workgroup & Databases Manual. ACX structures and numbers ChemBioDraw 13.0 searches ACX and returns information about related structures and numbers. You can place the returned information in your document.
ChemBioDraw 13.0 PerkinElmer Informatics To open the PerkinEmer Informatics Home Page, go to Online>Browse CambridgeSoft.com. Check the PerkinElmer Informatics Web site for new product information. You can also get to ChemNews.Com, and other pages through PerkinElmer Informatics home page. Using the ChemOffice SDK The ChemOffice Software Developer’s Kit (SDK) lets you customize your applications. To browse the ChemOffice SDK, go to Online>Browse ChemOffice SDK.
ChemBioDraw 13.0 Index 1 13C, 1H shifts, estimating 151 3 35 mm slide boundary lines 282 3D query properties 230 A abnormal valence 208 absolute flag, drawing 229 ACX information, finding 313 acyclic chains changing direction 29 drawing 29 adding 3D query property 230 chemical names 120 structures in ChemDraw/Excel 160 adding residues 68 adjustment handles 30 Adv. Synth.Catal.
ChemBioDraw 13.
ChemBioDraw 13.
ChemBioDraw 13.
ChemBioDraw 13.
ChemBioDraw 13.
ChemBioDraw 13.0 single 36 tool 35 usage 213 branched peptides 73 branching peptides 72 branching, calculating 186 bridges disulfide 74 lactam 75 C Cahn-Ingold-Prelog 296 calculations on products 196 CambridgeSoft Web site, accessing 314 CambridgeSoft.
ChemBioDraw 13.
ChemBioDraw 13.
ChemBioDraw 13.0 freezing point 303 Gibbs free energy 303 heat of formation 303 Henry’s Law 301 ideal gas thermal capacity 303 LogP 301 molar refractivity 301 thermal capacity 303 TPSA 303 chemical symbols circle minus 134 circle plus 134 minus (symbol) 134 plus (symbol) 134 rotating 136 chemical syntax checking 48 chemical warnings 48 disable 48 chemically significant text 292 chemicals, purchasing online 313 chemistry of ChemDraw chemistry checking ChemNews.
ChemBioDraw 13.
ChemBioDraw 13.
ChemBioDraw 13.
ChemBioDraw 13.
ChemBioDraw 13.0 document settings Adv. Synth.Catal. 274 J. Mol. Mod.
ChemBioDraw 13.
ChemBioDraw 13.
ChemBioDraw 13.
ChemBioDraw 13.
ChemBioDraw 13.
ChemBioDraw 13.0 hotkeys .
ChemBioDraw 13.0 integral groups, creating 45 internet, CambridgeSoft web site 314 ISIS V3000 support 240 isotopes specifications 293 isotopes table file 208 isotopes text file 208 isotopic abundance 208 J J. Mol. Mod.
ChemBioDraw 13.
ChemBioDraw 13.
ChemBioDraw 13.
ChemBioDraw 13.
ChemBioDraw 13.0 joining 44 moving 42 selecting 38 ungrouping 45 using crosshair with 284 using rulers with 283 objects ungrouping 45 objects, coloring 95 OLE 238 Online menu browse SciStore.com 313 CambridgeSoft home page 314 ChemBioOffice SDK 314 CS Chem3D technical support 312 lookup suppliers on SciStore.
ChemBioDraw 13.
ChemBioDraw 13.
ChemBioDraw 13.
ChemBioDraw 13.
ChemBioDraw 13.
ChemBioDraw 13.
ChemBioDraw 13.
ChemBioDraw 13.0 objects when transferring information scaling objects 45 237 45 Science of Synthesis 277 SciStore.
ChemBioDraw 13.
ChemBioDraw 13.
ChemBioDraw 13.
ChemBioDraw 13.
ChemBioDraw 13.
ChemBioDraw 13.
ChemBioDraw 13.
ChemBioDraw 13.
ChemBioDraw 13.0 work area 4 1 13C, 1H shifts, estimating 151 3 35 mm slide boundary lines 282 3D query properties 230 A abnormal valence 208 absolute flag, drawing 229 ACX information, finding 313 acyclic chains changing direction 29 drawing 29 adding 3D query property 230 chemical names 120 structures in ChemDraw/Excel 160 adding residues 68 adjustment handles 30 Adv. Synth.Catal.
ChemBioDraw 13.
ChemBioDraw 13.
ChemBioDraw 13.
ChemBioDraw 13.
ChemBioDraw 13.
ChemBioDraw 13.0 braces 35 brackets drawing 36 paired 36 single 36 tool 35 usage 213 branched peptides 73 branching peptides 72 branching, calculating 186 bridges disulfide 74 lactam 75 C Cahn-Ingold-Prelog 296 calculations on products 196 CambridgeSoft Web site, accessing 314 CambridgeSoft.
ChemBioDraw 13.
ChemBioDraw 13.0 ChemClub.
ChemBioDraw 13.
ChemBioDraw 13.
ChemBioDraw 13.
ChemBioDraw 13.
ChemBioDraw 13.
ChemBioDraw 13.0 disulfide bridges 74 DNA tool, customizing 54 document location, default 245, 248, 251, 254, 257 posters 279 setting up multi-paged 279 document settings Adv. Synth.Catal. 274 J. Mol. Mod.
ChemBioDraw 13.
ChemBioDraw 13.
ChemBioDraw 13.
ChemBioDraw 13.
ChemBioDraw 13.
ChemBioDraw 13.0 highlight box selecting 39 home page, CambridgeSoft 314 hot-linked properties 124 Hotkeys 246, 249, 252, 255, 258 creating 268 hotkeys.xml file 268 hotkeys .
ChemBioDraw 13.0 Info window 43 displaying fixed angles 15 insert name as structure 124 inserting name as structure 124 Inserting rows in tables 287 integral groups, creating 45 internet, CambridgeSoft web site 314 ISIS V3000 support 240 isotopes specifications 293 isotopes table file 208 isotopes text file 208 isotopic abundance 208 J J. Mol. Mod.
ChemBioDraw 13.
ChemBioDraw 13.0 M m/z, displaying 127 magnification control 279 magnifying with View menu Main toolbar MakeChemNMRUserDB.
ChemBioDraw 13.
ChemBioDraw 13.
ChemBioDraw 13.0 O objects 3D rotation aligning 34 284 bioDraw, customizing 54 copying 42 deleting 44 distributing 46 framing 36 grouping 44 joining 44 moving 42 selecting 38 ungrouping 45 using crosshair with 284 using rulers with 283 objects ungrouping 45 objects, coloring 95 OLE 238 Online menu browse SciStore.com 313 CambridgeSoft home page 314 ChemBioOffice SDK 314 CS Chem3D technical support 312 lookup suppliers on SciStore.
ChemBioDraw 13.
ChemBioDraw 13.
ChemBioDraw 13.
ChemBioDraw 13.
ChemBioDraw 13.
ChemBioDraw 13.
ChemBioDraw 13.
ChemBioDraw 13.0 save command default file format 8 saving structures in ChemDraw/Excel 161 saving changes automatically 8 saving documents 7 saving page setup settings 282 scaling fixed length 45 objects 45 when transferring information scaling objects 237 45 Science of Synthesis 277 SciStore.
ChemBioDraw 13.
ChemBioDraw 13.
ChemBioDraw 13.
ChemBioDraw 13.
ChemBioDraw 13.
ChemBioDraw 13.
ChemBioDraw 13.
ChemBioDraw 13.
ChemBioDraw 13.