
Datasheet


6
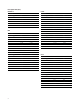
High Performance Green
Device Series Parameter Symbol Min. Typ. Max. Units Test Conditions
HDSP-360x Luminous Intensity/Segment
[1,2]
(Digit Average)
I
V
860 2700
Pcd
I
F
= 10 mA
HDSP-460x 1030 4000
Pcd
I
F
= 10 mA
All
Forward Voltage/Segment or DP V
F
2.1 2.5 V I
F
= 10 mA
Peak Wavelength
O
PEAK
566 nm
Dominant Wavelength
[3,7]
O
d
571 577 nm
Reverse Voltage/Segment or DP
[4]
V
R
3.0 50 V
I
R
= 100 PA
Temperature Coecient of V
F
/
Segment or DP
'V
F
/°C
-2 mV/°C
Thermal Resistance LED Junction-to-Pin
RT
J-PIN
280 °C/W/Seg
Notes:
1. Device case temperature is 25°C prior to the intensity measurement.
2. The digits are categorized for luminous intensity. The intensity category is designated by a letter on the side of the package.
3. The dominant wavelength, O
d
, is derived from the CIE chromaticity diagram and is that single wavelength which denes the color of the device.
4. Typical specication for reference only. Do not exceed absolute maximum ratings.
5. For low current operation, the AlGaAs HDSP-E10X series displays are recommended. They are tested at 1 mA dc/segment and are pin for pin
compatible with the HDSP-E15X series.
6. For low current operation, the HER HDSP-335X series displays are recommended. They are tested at 2 mA dc/segment and are pin for pin compatible
with the 5082-7650 series.
7. The Yellow (5082-7620/7660) and Green (HDSP-3600/4600) displays are categorized for dominant wavelength. The category is designated by a
number adjacent to the luminous intensity category letter.