
Datasheet

2
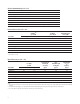
Absolute Maximum Ratings at T
A
= 25°C
Parameter AlInGaP GaP AS AlGaAs Units
DC Forward Current 30 25 25 mA
Power Dissipation 72 65 65 mW
Reverse Voltage (I
R
= 100mA) 5 5 5 V
LED Junction Temperature 95 95 95 °C
Operating Temperature Range -40 to 85°C
Storage Temperature Range -40 to 85 °C
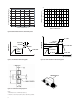
Soldering Temperature See reflow soldering profile (Figure 6 & 7)
Electrical Characteristics at T
A
= 25°C
Part Number
Forward Voltage
V
F
(Volts)
[1]
@ I
F
= 20mA
Reverse Breakdown
V
R
(Volts)
@ I
R
= 100mA
Thermal Resistance
Rq
J-P
(°C/W)
Typ. Max. Typ. Typ.
AlInGaP Amber 2.0 2.4 5 500
AlInGaP Red 2.0 2.4 5 500
GaP Green 2.2 2.6 5 300
AS AlGaAs Red 1.8 2.6 5 300
AlInGaP Orange 2.0 2.4 5 500
GaP HER 2.0 2.6 5 300
GaP Yellow 2.1 2.6 5 300
Notes:
1. VF tolerance : ±0.1V
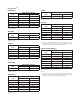
Optical Characteristics at T
A
= 25°C
Part Number
Luminous Intensity
I
V
[1]
(mcd)
@ 20mA
Color, Dominant
Wavelength
ld
[2]
(nm)
Typical
Color,
Peak Wavelength
lPeak [(nm)
Typical
Viewing Angle
2q
1/2
[3]
(Degrees)
TypicalMin. Typ.
AlInGaP Amber 28.5 76.9 591 594 115
AlInGaP Red 28.5 62.3 630 643 115
GaP Green 4.5 13.3 573 568 125
AS AlGaAs Red 7.2 30.7 642 657 125
AlInGaP Orange 28.5 108.6 604 611 115
GaP HER 2.8 5.1 621 636 125
GaP Yellow 2.8 9.3 589 588 125
Notes:
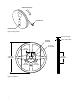
1. The luminous intensity IV is measured at the peak of the spatial radiation pattern which may not be aligned with the mechanical axis of the LED
package.
2. The dominant wavelength, ld, is derived from the CIE Chromaticity Diagram and represents the perceived color of the device.
3. q
1/2
is the off-axis angle where the luminous intensity is ½ the peak intensity.