
Technical data


Web Tools Administrator’s Guide 113
53-1002934-02
Performance Monitor overview
8
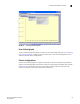
FIGURE 20 Accessing performance graphs
User-defined graphs
You can modify the predefined graphs to create your own customized graphs (refer to “Customizing
basic monitoring graphs” on page 115 for more information). These user-defined graphs can be
added and saved to canvas configurations.
Canvas configurations
A canvas is a saved configuration of graphs. The graphs can be either the Web Tools predefined
graphs or user-defined graphs. Each canvas can hold up to eight graphs per window, with six shown
in Figure 21. Up to 20 canvases can be set up for different users or different scenarios. Each
canvas is saved with a name and an optional brief description.