
Technical data


150 Web Tools Administrator’s Guide
53-1002934-02
Displaying switch information
10
If no data is available from a switch, the most recent background color remains displayed.
Any error-based status messages that is based on a per time interval cause the status to show
faulty until the entire sample interval has passed.
If the switch status is marginal or critical, information on the trigger that caused that status
displays in the Switch Information view.
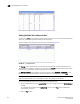
Click the Status button to display a detailed, customizable switch status report, shown in Figure 30.
Note that this is a static report and not a dynamic view of the switch.
FIGURE 30 Switch Report window
To check the physical health of the switch, perform the following steps.
1. Select a logical switch from the Logical Switch list in the top-right corner of the Switch Explorer
window.
The selected switch displays in the Switch View. The icon on the Status button indicates the
overall status of the switch.
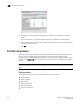
2. Click Status on the Switch View.
The detailed switch health report displays, as shown in Figure 30.
3. Optional: Click the underlined links in the left panel to display detailed information about ports
and Switch Availability Monitoring (SAM).
NOTE
You require Fabric Watch or Fabric Vision license to view the Port Detail Report.
The Port Detail Report and Switch Availability Monitor (SAM) reports display the details of only
those ports which are members of the current Admin Domain context and the E_Ports of the
switch.