
Technical data


Web Tools Administrator’s Guide 25
53-1002934-02
Displaying tool tips
2
For more information, refer to “Displaying switch information” on page 147.
Free Professional Management tool
You can use the Professional Management tool with Web Tools to view connectivity for each fabric,
to back up and restore last-known configurations, and more. You can also use it with the Enhanced
Group Management license to manage groups of switches, download firmware, manage security
settings, and deploy configurations across groups of switches. Contact your preferred storage
supplier to get a complimentary copy of the Professional Management tool.
Launch the install wizard for the free Professional Management tool through the link located at the
bottom of the Switch Explorer window.
Displaying tool tips
When you rest the pointer over a Web Tools button, the system displays a brief description of the
button. If you rest the pointer over most components, the system displays tool tip information about
the component.
In the Fabric Tree you can rest the pointer over a switch to view its type, subtype, name, Ethernet
IPv4 and IPv6 addresses, IPFC, and status of the switch.
In Switch View, you can rest the pointer over a blade to view the blade ID and its status. It is easier
to use the top of the blade to display the tool tip so that you do not inadvertently display the port
tool tips. Firmware versions and IP addressing are displayed for CP blades.
When you rest the pointer over a port, you can view the:
• Port name
• Port ID
• Port beacon
• Port number
• Port index
• Port type (E_Port, F_Port, L_Port, D_Port, Ex_Port, GigE Port, or U_Port)
• Port status (online or offline)
• Port state (in-sync, no_sync, no light, or no module)
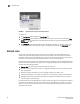
Right-click options
You can right-click a port to quickly perform some basic port administration tasks, as shown in
Figure 6.