
Technical data

Fabric OS Administrator’s Guide 9-5
Publication Number: 53-0000518-09
Viewing Port Information
9
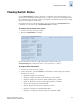
To view the status of a port
1. Connect to the switch and log in as admin.
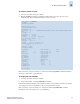
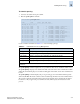
2. Enter the portShow command, specifying the number that corresponds to the port you are
troubleshooting. In this example, the status of port two is shown:
Refer to the Fabric OS Command Reference Manual for additional portShow command information,
such as the syntax for slot or port numbering.
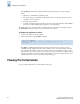
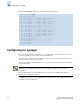
To display the port statistics
1. Connect to the switch and log in as admin.
2. At the command line, enter the portStatsShow command.
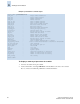
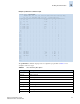
Port statistics include information such as number of frames received, number of frames sent, number
of encoding errors received, and number of class 2 and class 3 frames received.
Refer to the Fabric OS Command Reference Manual for additional portStatsShow command
information, such as the syntax for slot or port numbering.
switch:admin> portshow 2
portName:
portHealth: HEALTHY
Authentication: None
portDisableReason: None
portCFlags: 0x1
portFlags: 0x4903 PRESENT ACTIVE E_PORT G_PORT U_PORT LOGICAL_ONLINE LOGIN
LED
portType: 10.0
portState: 1 Online
portPhys: 6 In_Sync
portScn: 16 E_Port Trunk port
port generation number: 351
portId: 290200
portIfId: 43020004
portWwn: 20:02:00:05:1e:34:01:be
portWwn of device(s) connected:
None
Distance: normal
portSpeed: N4Gbps
Interrupts: 0 Link_failure: 50 Frjt: 0
Unknown: 0 Loss_of_sync: 55 Fbsy: 0
Lli: 524 Loss_of_sig: 54
Proc_rqrd: 0 Protocol_err: 0
Timed_out: 0 Invalid_word: 0
Rx_flushed: 0 Invalid_crc: 0
Tx_unavail: 0 Delim_err: 0
Free_buffer: 0 Address_err: 0
Overrun: 0 Lr_in: 100
Suspended: 0 Lr_out: 50
Parity_err: 0 Ols_in: 50
2_parity_err: 0 Ols_out: 52
CMI_bus_err: 0
switch:admin>