
Technical data


Web Tools Administrator’s Guide 11-1
Publication Number: 53-0000522-09
Chapter
11
Working With Diagnostic Features
This chapter contains the following information:
• “Managing Trace Dumps,” next
• “Displaying Switch Information” on page 11-4
• “Interpreting Port LEDs” on page 11-8
• “Displaying Port Information” on page 11-10
Managing Trace Dumps
A trace dump is a snapshot of the running behavior within the SilkWorm switch. The dump can be used
by developers and troubleshooters at Brocade to help understand what might be contributing to a
specific switch behavior when certain internal events are seen. For example, a trace dump can be
created each time a certain error message is logged to the system error log. Developers can then
examine what led up to the message event by studying the traces.
Tracing is always “on.” As software on the switch executes, the trace information is placed into a
circular buffer in system RAM. Periodically, the trace buffer is “frozen” and saved. This saved
information is a trace dump.
A trace dump is generated when:
• it is triggered manually (use the traceDump command)
• a critical-level LOG message occurs
• a particular LOG message occurs (use the traceTrig command to set up the conditions for this)
• a kernel panic occurs
• the hardware watchdog timer expires
(For information about the traceDump and traceTrig commands, refer to the Fabric OS Command
Reference Manual.)
The trace dump is maintained on the switch until either it is uploaded to the FTP host or another trace
dump is generated. If another trace dump is generated before the previous one is uploaded, the previous
dump is overwritten.
When a trace dump is generated, it is automatically uploaded to an FTP host if automatic FTP uploading
is enabled.
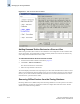
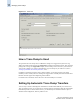
Using the Trace tab of the Switch Admin module, you can view and configure the trace FTP host
target, enable or disable automatic trace uploads, and manually upload a trace dump (see Figure 11-1 on
page 11-2).