
Technical data


11-4 Web Tools Administrator’s Guide
Publication Number: 53-0000522-09
Displaying Switch Information
11
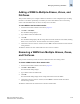
To upload the trace dump
1. Launch the Switch Admin module as described on page 4-3.
2. Click the Trace tab.
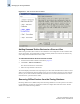
The Trace Dump Availability section displays whether a trace dump is available. If the Trace
Auto FTP Uploaded box is checked, the trace dump has been automatically uploaded to the FTP
host.
3. Click Upload Trace. If the Upload Trace button is inactivated, it means that a trace dump is not
available.
The Upload Trace dialog displays, along with the default trace dump file name.
4. Optional: Type a new trace dump file name if you want to change it from the default name.
5. For the SilkWorm 12000, 24000, and 48000 only, click the CP (active or standby) from which
the trace dump is to be uploaded.
If the CP does not have a trace dump, that CP selection is disabled.
6. Click OK.
Displaying Switch Information
This section describes how to display information about the physical components of the switch (such as
fan, temperature, and power supply) as well as how to display other detailed switch information (such
as firmware and IP address).
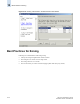
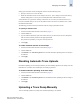
Displaying Detailed Fan Hardware Status
The background color of the Fan button indicates the overall status of the fans. For more information
about the switch fan, refer to the appropriate hardware documentation.
You can display status information about the fans, as shown in Figure 11-2 on page 11-5.
Note
The SilkWorm 3016 Switch View does not have a Fan button as there are no fan FRUs in this embedded
switch.