
Technical data


Web Tools Administrator’s Guide 13-1
Publication Number: 53-0000522-09
Chapter
13
Administering Fabric Watch
This chapter contains the following sections:
• “Introduction to Fabric Watch,” next
• “Using Fabric Watch with Web Tools” on page 13-2
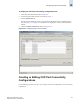
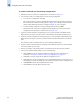
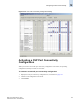
• “Configuring Fabric Watch Thresholds” on page 13-3
• “Configuring Alarms for FRUs” on page 13-6
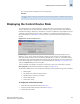
• “Displaying Fabric Watch Alarm Information” on page 13-7
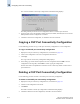
• “Configuring Email Notifications” on page 13-8
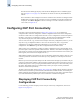
Introduction to Fabric Watch
Fabric Watch is a Brocade optionally licensed feature that monitors the performance and status of
switches and can automatically alert you when problems arise, before they become costly failures.
Fabric Watch tracks a variety of SAN fabric elements, events, and counters. For example, Fabric Watch
monitors:
• Fabric resources, including fabric reconfigurations, zoning changes, and new logins.
• Switch environmental functions, such as temperature, power supply, and fan status, along with
security violations.
• Port state transitions, errors, and traffic information for multiple port classes as well as operational
values for supported models of Finisar “Smart” GBICs/SFPs.
• Performance information for AL_PA, end-to-end, and SCSI command metrics.
Fabric Watch lets you define how often to measure each switch and fabric element and allows you to
specify notification thresholds. Whenever fabric elements exceed these thresholds, Fabric Watch
automatically provides notification using several methods, including email messages, SNMP traps, and
log entries.
For more detailed information regarding Fabric Watch, refer to the Fabric Watch Administrator’s
Guide.
Note
To use the Fabric Watch feature, you must have a Fabric Watch license installed on your switch.