
Technical data


Web Tools Administrator’s Guide 14-3
Publication Number: 53-0000522-09
Monitoring Performance Using Web Tools
14
The labeling of axes in the graphs depends on the switch type. For the SilkWorm 12000, 24000, and
48000 directors, slot numbers are displayed with “expansion” arrows next to them, as shown in Figure
14-1 on page 14-4. Click the arrows to expand and contract the list of ports per slot. For the SilkWorm
200E, 3014, 3016, 3250, 3850, 3900, 4012, and 4100 switches, slot numbers are not identified.
Port throughput utilization is represented by a horizontal bar for each selected port, which gets longer or
shorter depending on the percent utilization for that port at the last poll time. Thin short vertical
intersecting bars give a historical perspective by representing the highest and lowest values reached for
each selected port since the graph was opened. A third bar between them represents the average of all
values polled. (See Figure 14-1.)
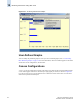
Figure 14-1 shows how to access the list of Advanced Performance Monitoring graphs using Web
Tools. This example displays the graphs available in the Performance Monitor module for a
SilkWorm 24000 director with the Advanced Performance Monitoring license installed. Note that the
slot number is identified.
Table 14-2 Advanced Performance Monitoring Graphs
Graph Type Description
SID/DID Performance Displays the traffic between the SID-DID pair on the switch being
managed. For more information, refer to “Creating an SID-DID
Performance Graph” on page 14-8.
SCSI vs. IP Traffic Displays percentage of SCSI versus IP frame traffic on each
individual port. For more information, refer to “Creating a SCSI vs.
IP Traffic Graph” on page 14-10.
AL_PA Errors Displays CRC errors for a given port and a given AL_PA. For more
information, refer to “Creating an AL_PA Error Graph” on
page 14-11.
SCSI Commands by port and
LUN (R, W, R/W)
Displays the total number of read/write commands on a given port to
a specific LUN. For more information, refer to “Creating a SCSI
Command Graph” on page 14-10.