
Technical data


14-4 Web Tools Administrator’s Guide
Publication Number: 53-0000522-09
Monitoring Performance Using Web Tools
14
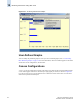
Figure 14-1 Accessing Performance Graphs
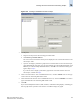
User-Defined Graphs
You can modify the predefined graphs to create your own customized graphs (refer to “Customizing
Basic Monitoring Graphs” on page 14-6 for more information). These user-defined graphs can be added
and saved to canvas configurations, described next.
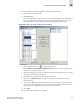
Canvas Configurations
A canvas is a saved configuration of graphs. The graphs can be either the Web Tools predefined graphs
or user-defined graphs. Each canvas can hold up to eight graphs per window, as shown in Figure 14-2.
Up to 20 canvases can be set up for different users or different scenarios. Each canvas is saved with a
name and an optional brief description.