
Technical data


Web Tools Administrator’s Guide 14-5
Publication Number: 53-0000522-09
Launching the Performance Monitor Module
14
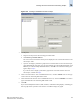
Figure 14-2 Canvas of Eight Performance Monitoring Graphs
Launching the Performance Monitor Module
Use the following procedure to launch the Web Tools Performance Monitor module.
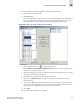
To launch the Performance Monitor module
1. Select a switch from the Fabric Tree. The selected switch appears in the Switch View.
2. Click the Perf button on the Switch View.
The Performance Monitor module displays.
Creating a Basic Performance Monitor Graph
Use the following procedure to create the basic performance monitor graphs listed in Table 14-1 on
page 14-2.
To create a basic performance monitor graph
1. Launch the Performance Monitor module as described on page 14-5.
2. Click Performance Graphs > Basic Monitoring > Graph Type.