
Technical data


14-6 Web Tools Administrator’s Guide
Publication Number: 53-0000522-09
Customizing Basic Monitoring Graphs
14
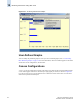
Depending on the type of graph you select, you might be prompted to select a slot or port for which
to create a graph (see Figure 14-3).
Figure 14-3 Creating a Port Throughput Graph
3. If prompted, drag the port into the Enter/drag slot,port field, or manually type the slot and port
information in the field, in the format slot,port.
For SilkWorm 12000, 24000, and 48000 directors, you must select first a slot number and then a
port number.
For SilkWorm 200E, 3014, 3016, 3250, 3850, 3900, 4012, and 4100 switches, you need type only
a port number.
4. Click OK.
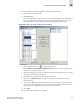
The graph is displayed in a window in the Performance Monitor module. The following section
explains how you can customize some of these graphs.
Customizing Basic Monitoring Graphs
You can customize some of the basic performance monitoring graphs to display information for
particular ports. For the SilkWorm 12000, 24000, and 48000 directors, you can also customize these
graphs to display information for a slot.
You can customize the following graphs:
• Switch Throughput Utilization Graph
• Switch Percent Utilization Graph
• Port Snapshot Error Graph
The following procedure assumes that you have already created one of these customizable graphs.
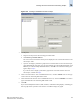
To customize basic performance monitoring graphs
1. Create or access the graph you want to customize. Refer to “Creating a Basic Performance Monitor
Graph” on page 14-5 for instructions on creating a graph.
2. For SilkWorm 12000, 24000, and 48000 directors, to display detailed port throughput utilization
rates for each port in a slot, click the arrows next to a slot. Port information for that slot is displayed
in the graph.
For SilkWorm 200E, 3014, 3016, 3250, 3850, 3900, 4012, and 4100 switches, proceed to step 3.