
Technical data


Web Tools Administrator’s Guide 14-7
Publication Number: 53-0000522-09
Customizing Basic Monitoring Graphs
14
3. To display detailed port throughput utilization rates for particular ports only:
a. Right-click anywhere in the graph.
b. Click Select Ports.
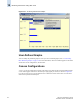
The setup dialog displays, as shown in Figure 14-4. The title of the dialog varies, depending on
the type of graph you are customizing, but the layout of the dialog is the same. Figure 14-4
shows an example of the setup dialog for the Switch Throughput Utilization graph.
Figure 14-4 Switch Throughput Utilization Setup Dialog
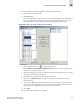
c. Double-click the domain icon to expand the slot/port list.
For the SilkWorm 12000, 24000, and 48000 directors, click the + signs to expand the ports
under each slot, as shown in Figure 14-4.
d. Click the particular port you want to monitor in the graph in the Port Selection List. Use Shift-
click and Ctrl-click to select multiple ports.
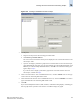
e. Click Add to move the selected ports to the Selected Ports list.
f. Optional: Click ADD ALL Ports to add all of the ports in the Port Selection List to the
Selected Ports list.
g. Optional: Click Search to launch the Search Port Selection List dialog, from which you can
search for all E_Ports, all F_Ports, or all port names with a defined string. Select the ports you
want to add and click Search in the Search Port Selection List dialog.
h. Click Apply.
Only the selected ports are displayed in the graph.