
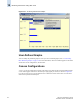
Technical data


14-8 Web Tools Administrator’s Guide
Publication Number: 53-0000522-09
Creating Advanced Performance Monitoring Graphs
14
Creating Advanced Performance Monitoring Graphs
This section describes how to create the advanced performance monitor graphs listed in Table 14-2 on
page 14-3. Because the procedure for creating these graphs differs depending on the type of graph, each
type is described separately in the sections that follow.
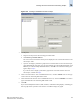
Creating an SID-DID Performance Graph
The SID/DID Performance graph displays the traffic between a SID-DID pair on the switch being
managed.
To create an SID/DID performance graph
1. Launch the Performance Monitor module as described on page 14-5.
2. Click Performance Graphs > Advanced Monitoring > SID/DID Performance.
The SID/DID Performance Setup dialog displays (see Figure 14-5 on page 14-9).
If you want to see which end-to-end (EE) monitors are currently set up on a particular port, proceed
to step 3.
If you want to specify the port, source ID, and domain ID, skip to step 4.
Note
You must have an Advanced Performance Monitoring license installed to use the advance performance
monitor features.